Model runs
Create and compare model training experiments.
A model run is a model training experiment within a model directory. Each model run provides a versioned data snapshot of the data rows, annotations, and data splits for that model run. You can upload predictions to the model run and compare its performance against other model runs in a model directory.
Overview
Once you create a model and choose the labeled data rows for training, you can create a model run to keep track of your model training experiment. It is important to put your model run into the model directory with the correct data rows and ontology configured when creating the model directory.
During the model run creation process, you can specify how to split the selected data rows into training, validation, and testing sets. To learn more, see Splits.
Labelbox versions your data rows, annotations, and data split at the time of training, making it easy for you to reproduce your model and compare models trained on different data versions. When doing so, you will have three views to inspect your model experiments: the gallery view, the metrics view, and the projector view.
Gallery view
After you upload predictions to a model run, you can use the gallery view to visually compare your model predictions against the ground truth labels. This qualitative inspection should help you gain a better general understanding of your model's behavior.

Use the dropdown to switch between model runs.
Filtering and sorting
Powerful filtering and sorting make it easier and more efficient to analyze the performance of neural networks, find low-performing slices of data, surface labeling mistakes, and identify high-impact data to use for re-labeling. For details on how to filter and sort data rows in the gallery view, please see the following pages:
Display settings
You can customize the display of the gallery view, by opening the Display panel. From there, you can customize the following settings:
| Display setting | Description |
|---|---|
| Thumbnail size | Adjust the size of the thumbnails in the gallery view. |
| Assets > Greyscale coloring | Color the assets in grayscale to allow annotations and predictions to stand out. |
| Assets > Pin data row details | Overlay identifying details of the data row at the top of the displayed thumbnails. |
| Ground truth | Includes toggles to show/hide ground truth annotation objects (bounding boxes, entities, polygons, etc.), segmentation masks, and classifications on thumbnails. |
| Predictions | Includes toggles to show/hide prediction annotation objects (bounding boxes, entities, polygons, etc.), segmentation masks, and classifications on thumbnails. |
| Object colors (non-segmentation tool types) | With Color by feature selected, all annotations and predictions associated with the same feature have the same color. Annotations have solid lines and predictions have dashed lines. With Color by source selected, all annotations have solid green lines and all predictions have dashed red lines. |
| Segmentation colors | Coming soon. |
Metrics view
The metrics view helps you analyze the distribution of annotations and predictions in your data, evaluate the performance of a model, and quantitatively compare two models.
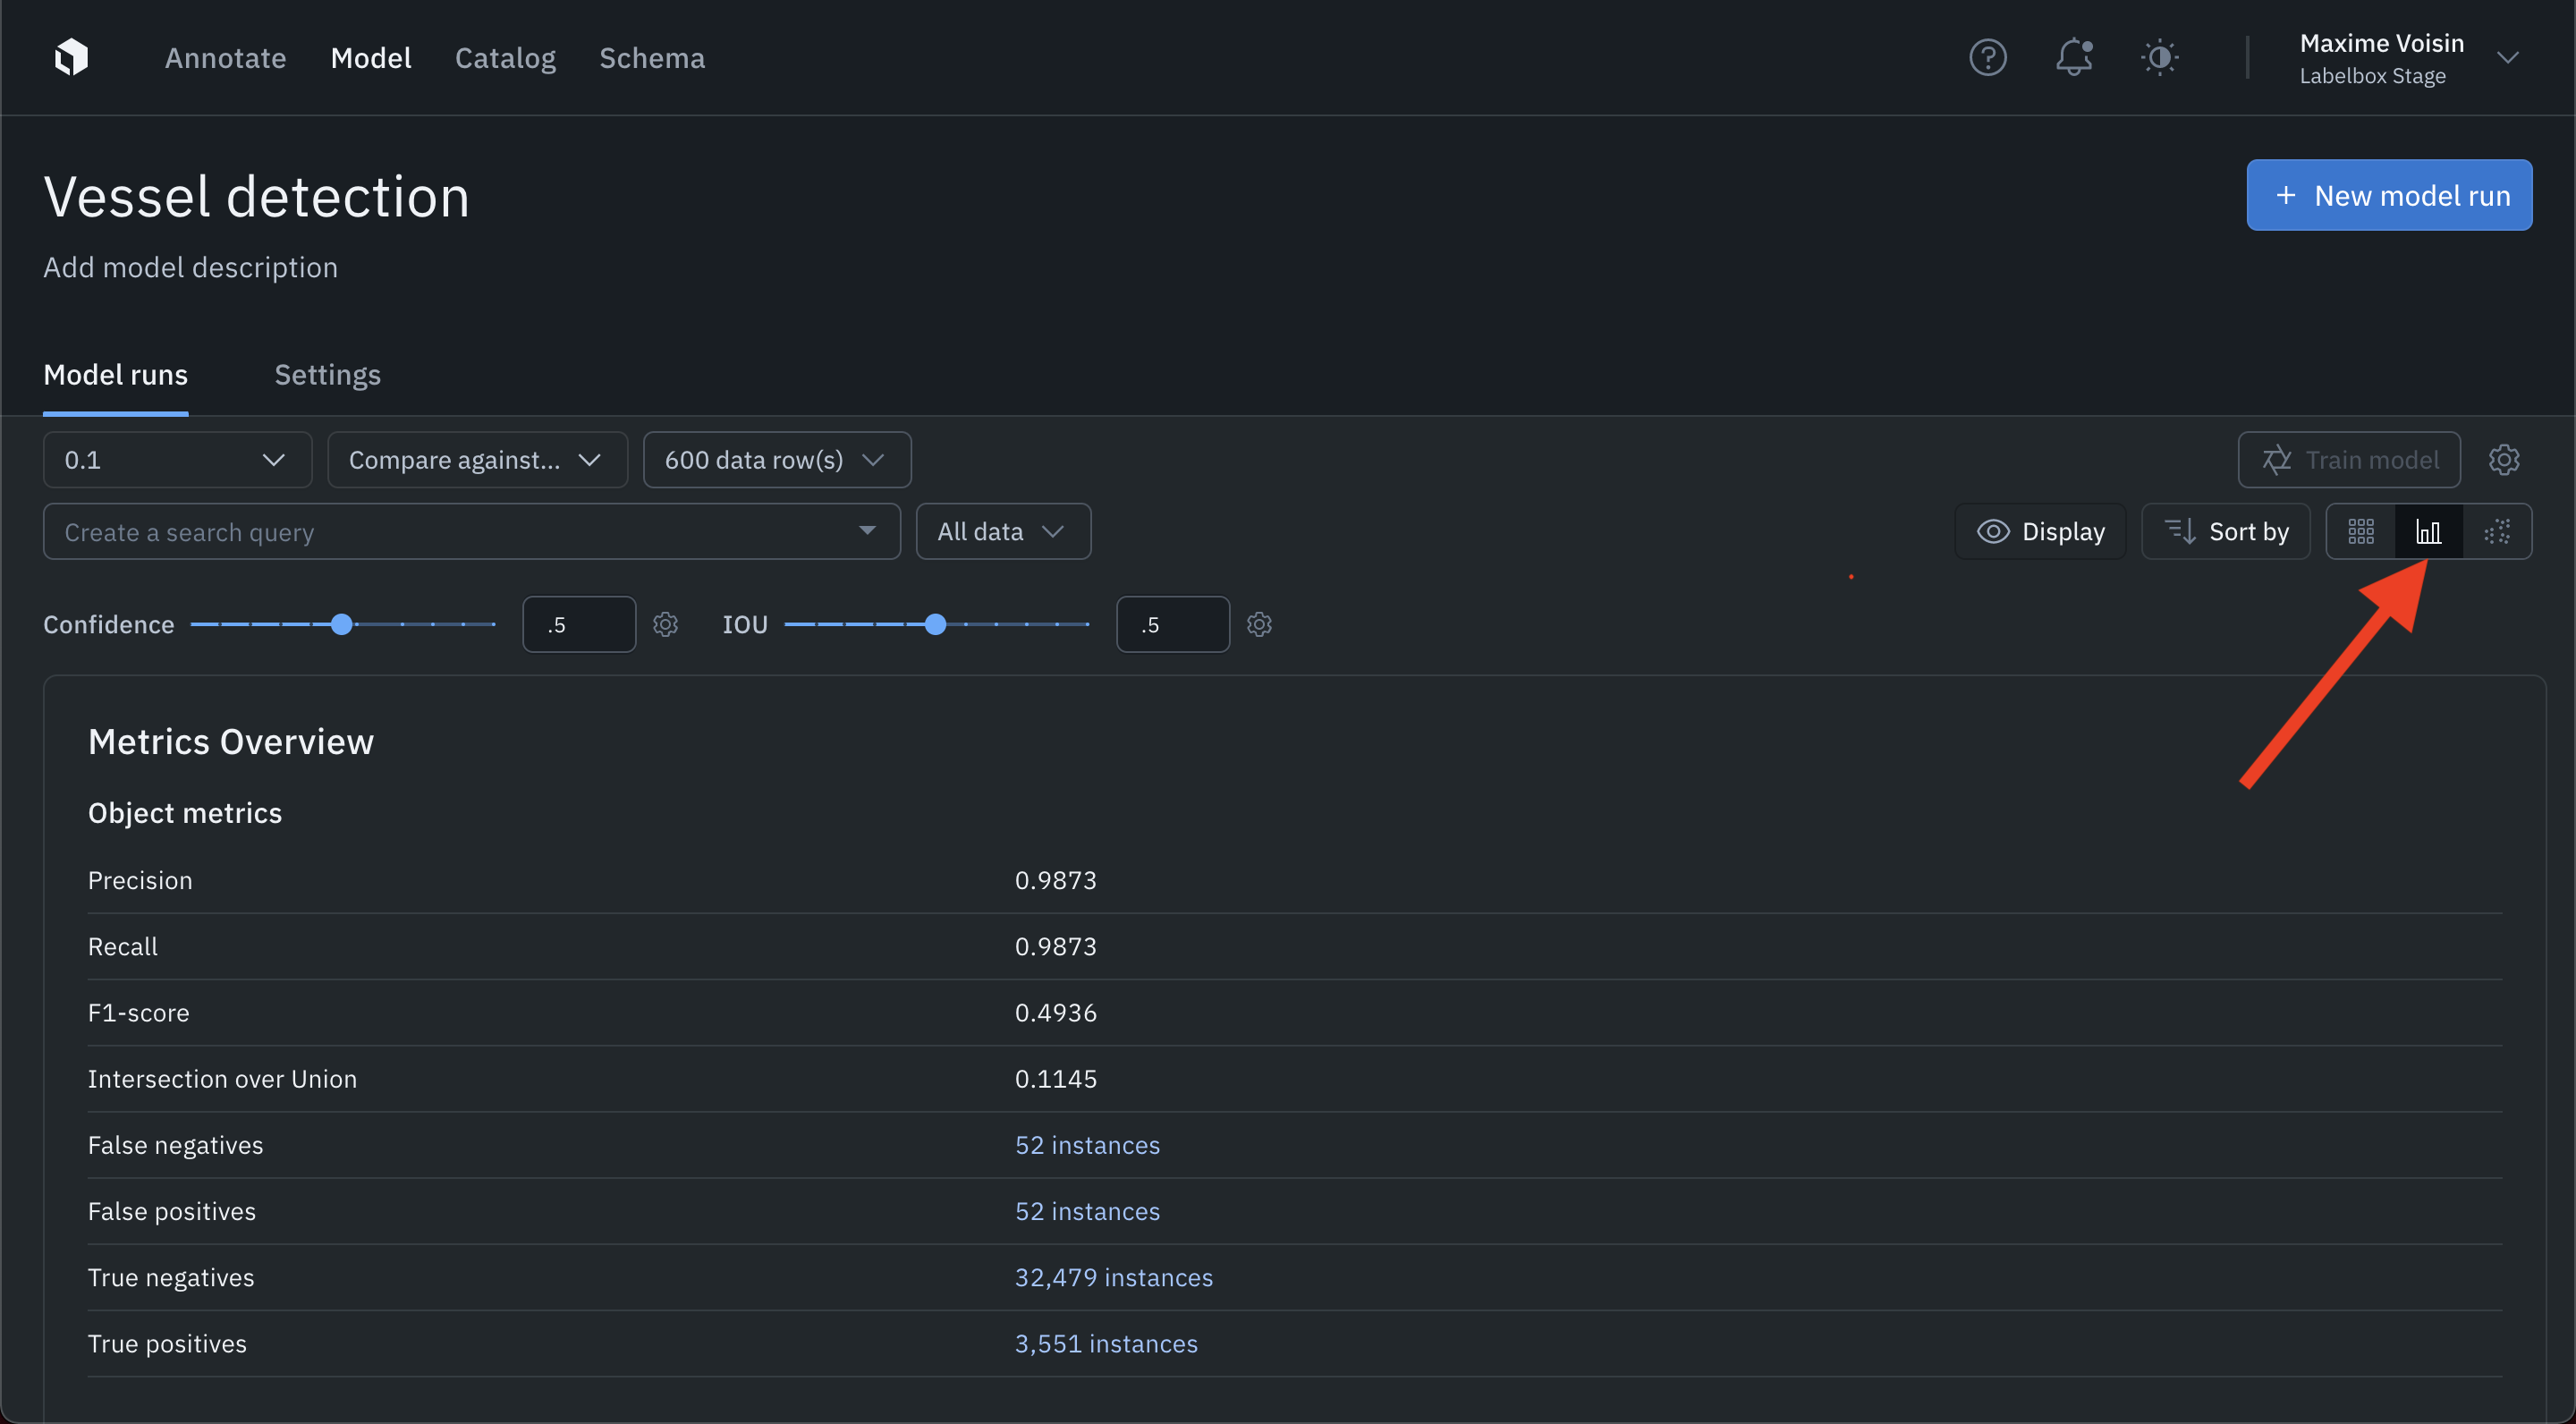
Switch to the metrics view by clicking the metrics icon in the top right corner.
For details on utilizing the metrics view, please see Model metrics.
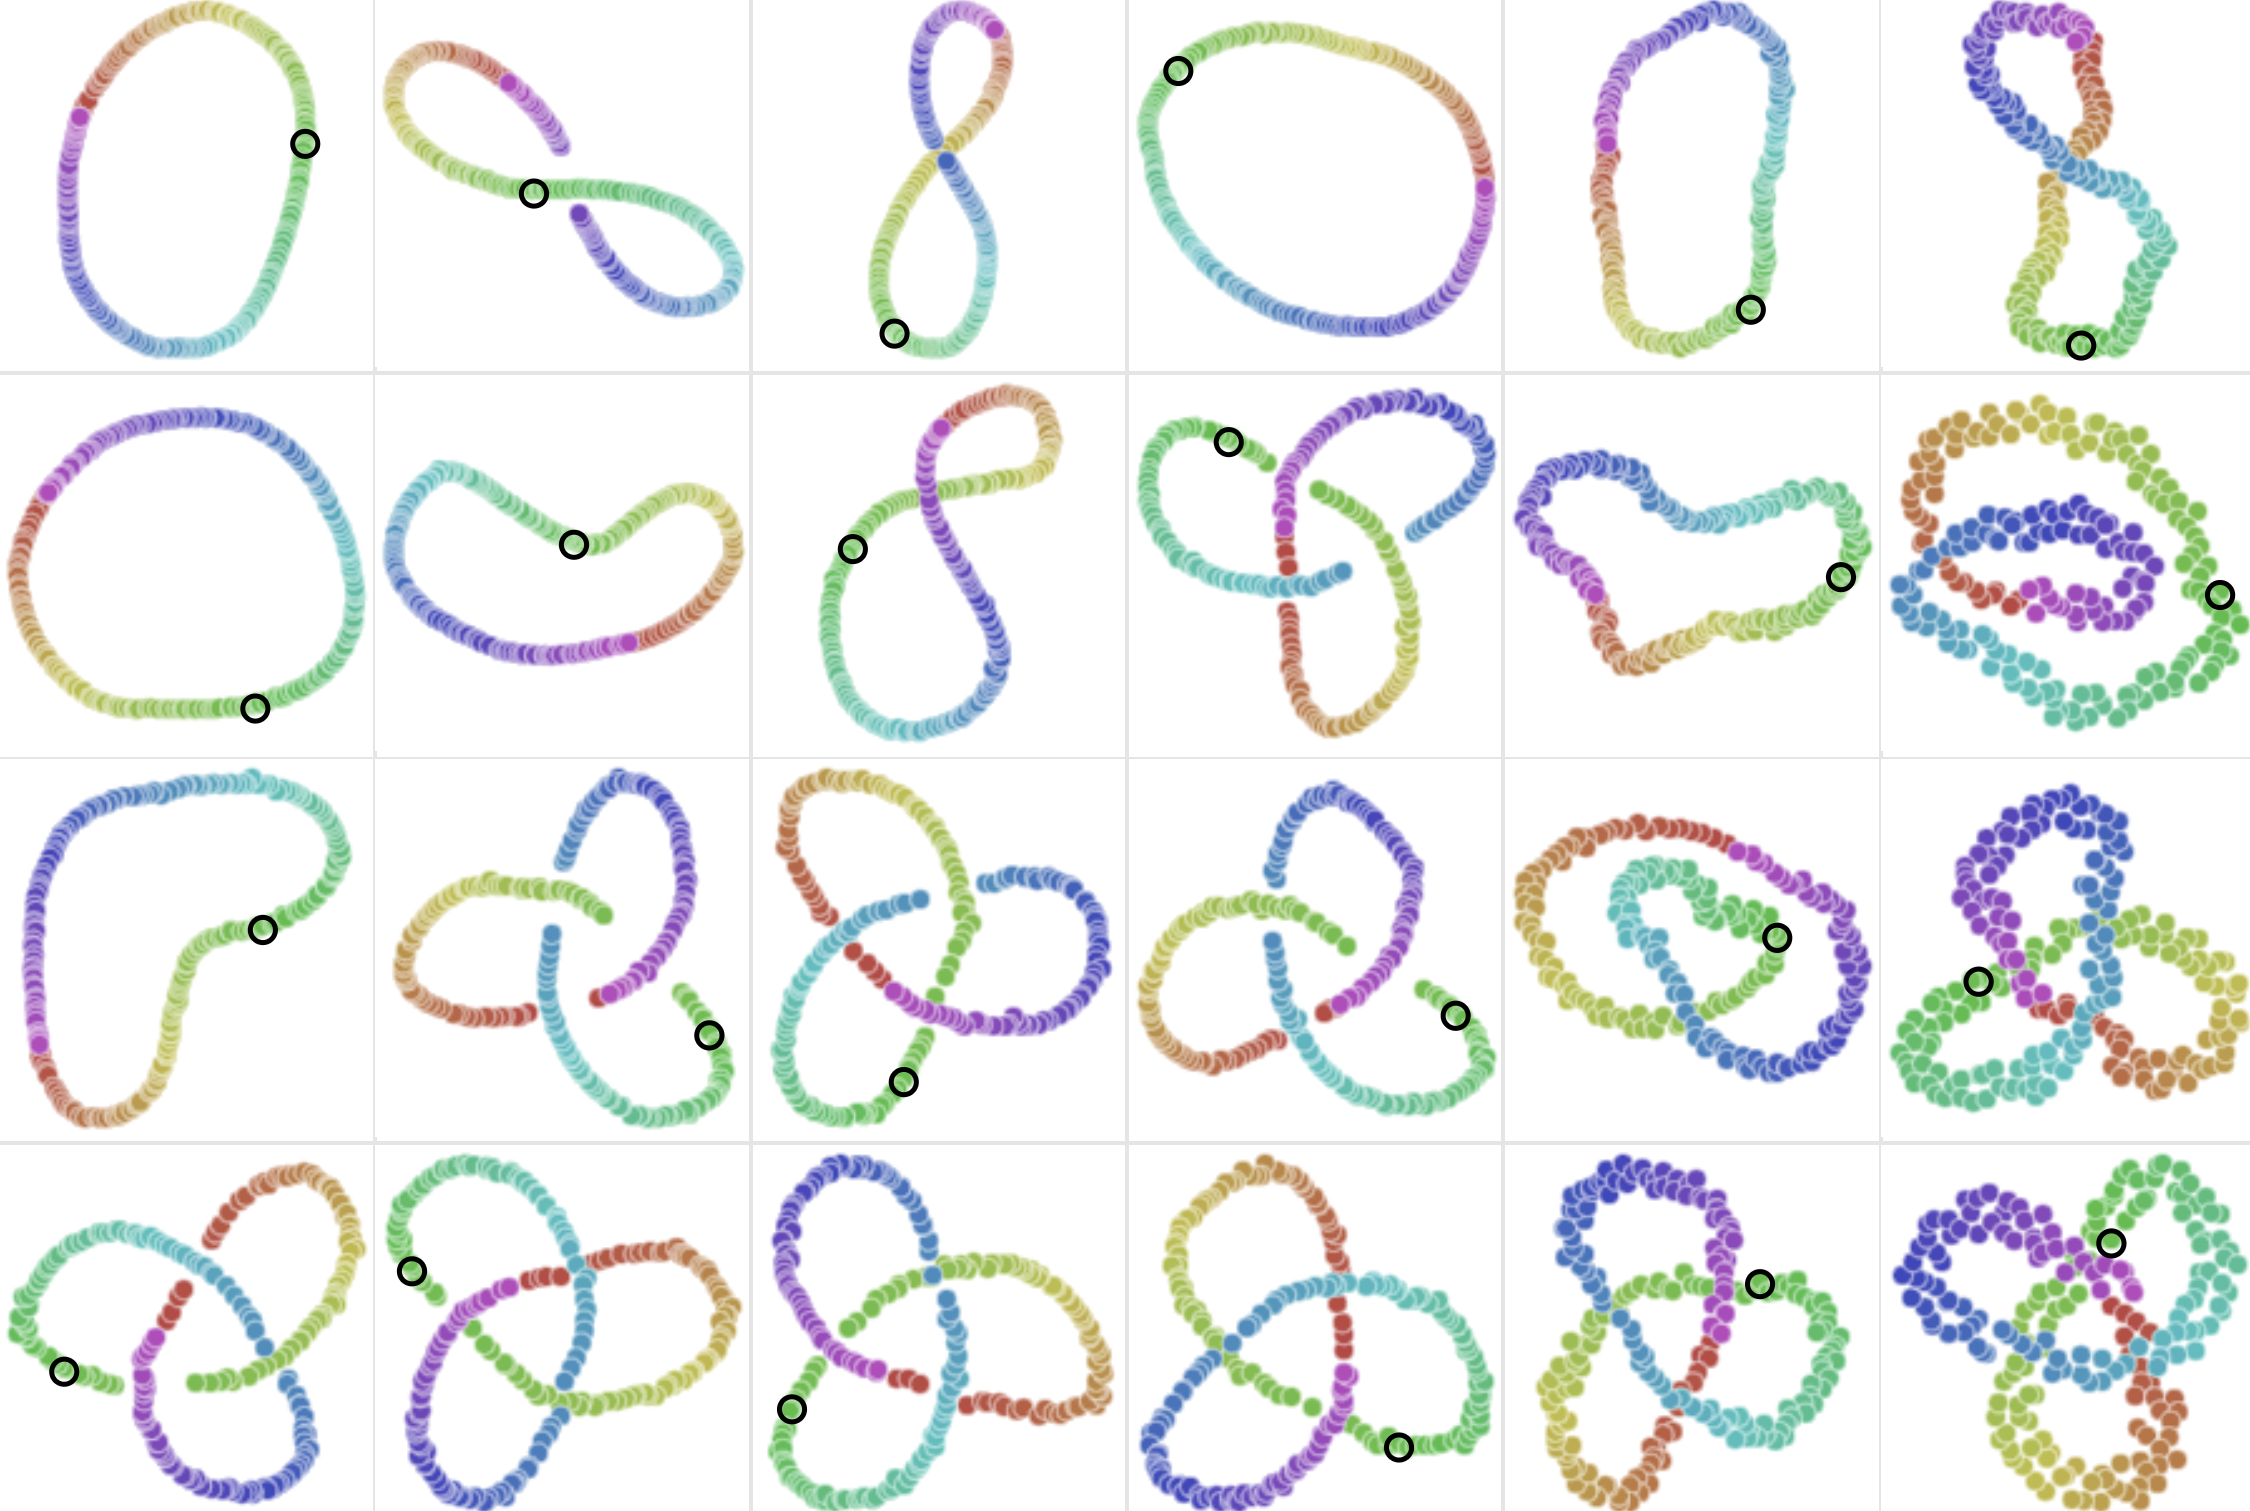
Projector view
An embedding projector is a tool for uncovering patterns in unstructured data that can be used to diagnose systemic model and labeling errors. The embedding projector works for data rows that have embeddings. Most embeddings have much higher dimensions than 2 or 3, making it impossible to identify global patterns. You can use the projector tool to employ dimensionality reduction algorithms to explore embeddings in 2D interactively.
Note: Projector view is in beta and currently supports up to 100,000 data rows.
To switch to the projector view, click on the projector icon in the top right corner.

The projector view helps you explore and understand the data of a model run.
We support two algorithms for dimensionality reduction, UMAP & PCA, which can be toggled. PCA is much faster but does not attempt to find clusters in the data. UMAP is better for finding regions of similar points in the data. Sphereize data normalizes the data by subtracting the mean and dividing by the norm.
To learn more about UMAP and dimensionality reduction, check out this guide below from Google.
Supported methods
| Method | Speed | Clustering |
|---|---|---|
| PCA: Principal Component Analysis | Fast | No |
| UMAP: Uniform Manifold Approximation and Projection | Slow | Yes |
Use the selection tool to isolate data rows for further investigation. To drill into a set of data rows further, click the selected data rows button in the top right and click Filter to select. This will re-run the dimensionality reduction algorithm you selected on the subset of data rows to surface local clusters in the data.
Model run config
You can use model run config to create, version, and track your hyperparameters and any training-related configurations for a model run.
It is common for ML teams to kick off multiple model runs with different sets of hyperparameters so they can compare their performance. Having the model configs logged is crucial for troubleshooting a model, sharing best practices, and reproducing model results.
On a model run page, click the Settings icon and select Model run config. If you have not created a model run config for this model run before, there will be a pre-populated template with common hyperparameters and their default values of None.
You can modify the values (must be booleans, strings, or numbers) and save them. The format of the model run config must be a valid JSON.
To load the previous model run's config, toggle on Use another model run's config as a template and modify the template.

You can also click the trash icon to reset all content and the copy icon to copy the content of the model run config in your clipboard.
To export and download the model run config, click the download icon.
Updated 4 months ago