Active deprecations
This section lists all products and features which are currently in a deprecation period.Completed deprecations
This section lists all products and features which have been decommissioned. These products and features are no longer available.Model experiments
As of July 15th, the Model experiments feature is no longer available. Note: This update does not impact any of the “Foundry” models or capabilities.Code runner
Code Runner was a Labelbox feature that allowed users to execute small code snippets directly within MMC conversations via Cloud Run functions. Code runner was sunset on July 7, 2026 due to lack of usage.Prompt and response editor
The Prompt and response editor in the Annotate product was sunset on June 30, 2026.Public Demo organization
The public demo workspace in the Labelbox platform was created to provide sample projects for users to explore the platform’s features and capabilities. It was sunset on April 3, 2026.Census integration
As of June 30, 2025, we no longer support the Census integration.Export v2 nonstreamable methods
In May 2025, we introduced changes to the Python SDK that broke compatibility with the following Export v2 non-streamable methods in version 3.67 and earlier:catalog.export_v2()data_row.export_v2()dataset.export_v2()model_run.export_v2()project.export_v2()slice.export_v2()
export() method, which provides a more scalable and performant way to export data across the Labelbox platform. To learn more, see Export overview.
Automation efficiency score
On April 16, 2025, we removed Automation efficiency score from the Labelbox platform.Catalog cluster view
On February 28, 2025, we deprecated Catalog cluster view for all customers due to a lack of usage.Smart select
In February 2025, we deprecated the Smart select button for selecting datasets on the Catalog page.Reporting (Enterprise Dashboard)
In February 2025, we deprecated the Reporting page (Enterprise Dashboard) for all customers. The Monitor tab offers all of the same metrics and filters (plus more). Unlike the Reporting page, the Monitor page is a native solution that is built into the Labelbox platform, so it offers a more seamless and robust user experience. To learn more, read this guide.DICOM editor
Due to a lack of usage, we sunsetted the DICOM editor on November 25, 2024.YOLO models in Foundry
On November 7th 2024, Labelbox disabled YOLO models in Foundry due to a lack of usage. Foundry still supports other object detection and segmentation model alternatives (OWL-ViT, Rekognition, GroundingDINO, GroundingDINO + SAM). If you would like to set up your own YOLO model for inferencing, refer to our custom model integration docs.Fine-tuning
On November 7th 2024, Labelbox disabled the model fine-tuning feature. This means that image fine-tuning is no longer usable. We may re-enable the fine-tuning feature in the future.Export V1
In early September, we disabled Export v1 for all remaining customers. All users should use theexport() method instead.
Data connector libraries
All data connector libraries, includinglabelbase, labelspark, labelpandas, labelsnow, and labelbox-bigquery libraries, have been publicly archived and are no longer maintained.
Custom editor
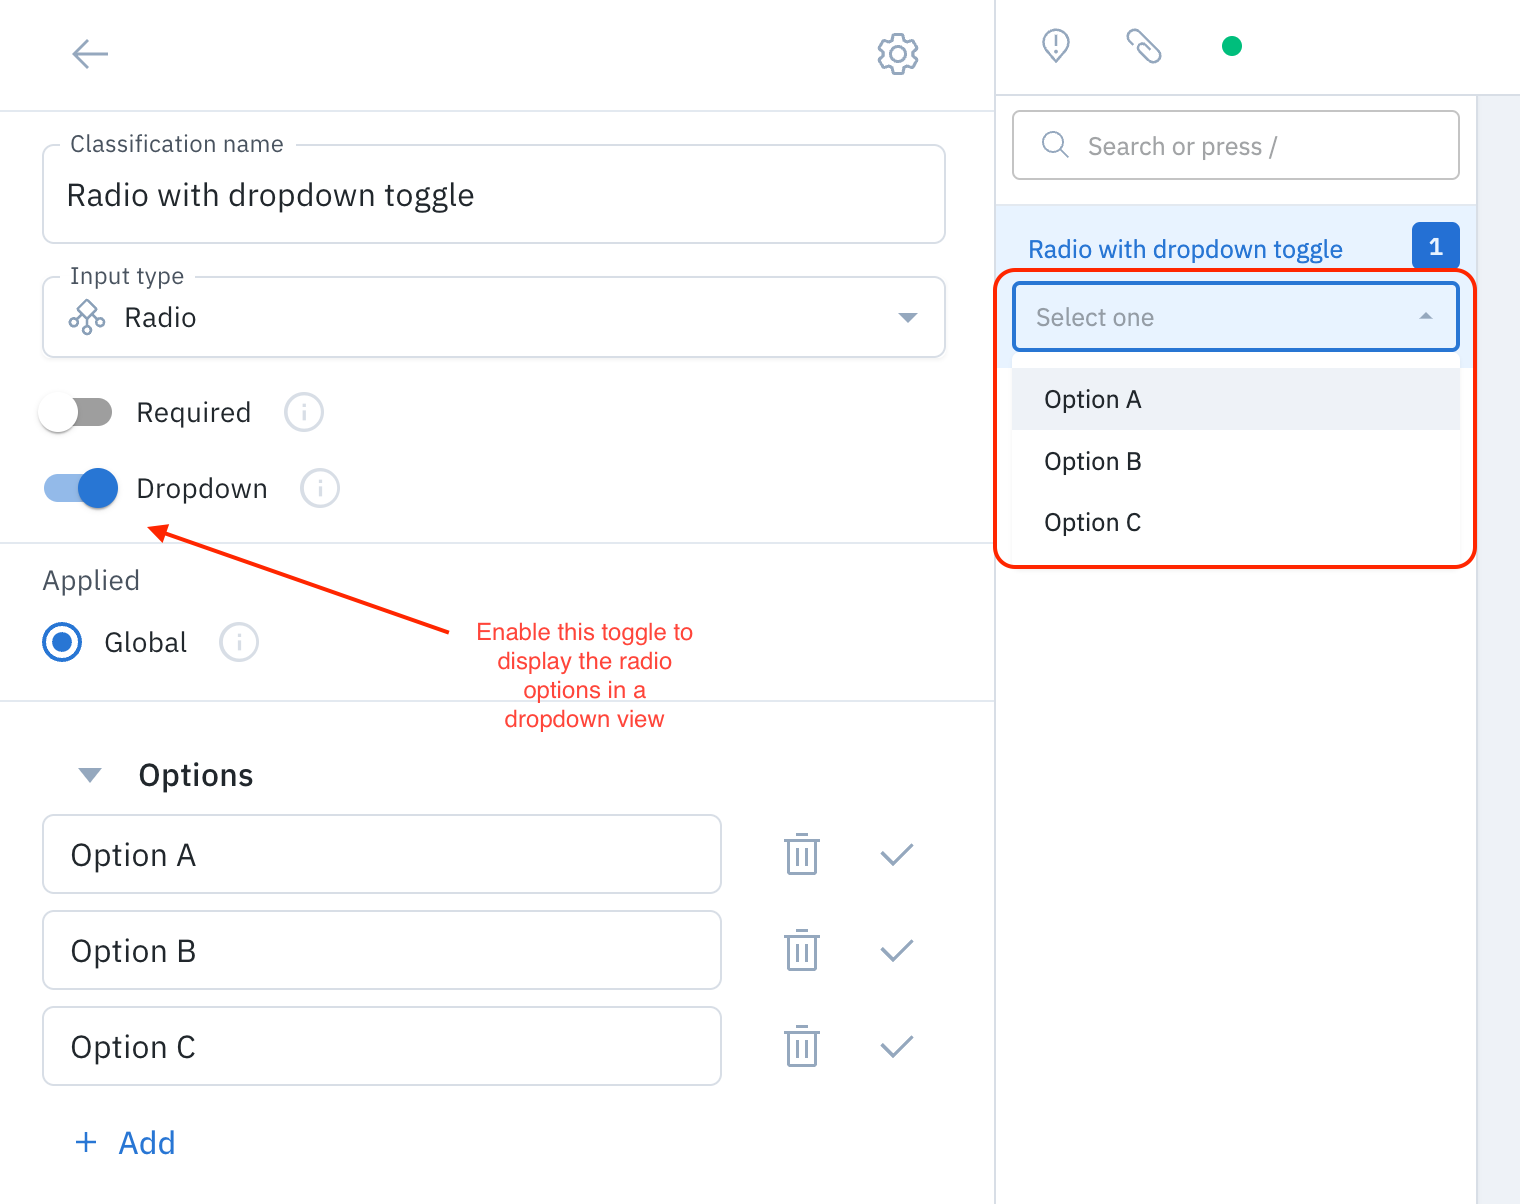
We sunsetted the custom editor for all customers on June 30, 2024. Custom editor projects and their associated labels are no longer accessible. Please use one of our native labeling editors instead.Dropdown schema
Dropdown is a deprecated classification type (the other classification types are radio, checklist, and free-form text). Labelbox implemented a UI solution that provides a dropdown view for radio and checklist classifications. Therefore, we removed the capability to add the dropdown schema to new ontologies. We recommend using radio or checklist classifications and selecting the dropdown toggle instead (see image below).