> ## Documentation Index
> Fetch the complete documentation index at: https://docs.labelbox.com/llms.txt
> Use this file to discover all available pages before exploring further.
# Performance dashboard
> Information on the project performance dashboard and the included metrics.
The performance dashboard helps you manage labeling operations in your Labelbox projects by reporting on the throughput, efficiency, and quality of your labeling process. You can see analytics for the overall project and for individual labelers. Filters are available to help you focus on specific information and dimensions.
The performance of your data labeling operation is broken down into four components, each with unique views to help you understand the overall performance:
* **Individual**
* **TEQ** (Throughput, Efficiency, and Quality)
* **Participation**
* **Instructions quiz** (see [Labeling instructions](/docs/instructions-and-quizzes))
You can use the filters at the top of the performance dashboard to analyze relevant subsets of data. When active, these filters apply to all metric views, including Throughput, Efficiency, and Quality. The following filters are available:
| Filter | Description |
| -------------------------- | ---------------------------------------------------------------------------------------------------------------------------------------------------------------------------------- |
| Batch | Filters the graphs and metrics by data rows belonging to a specific batch. |
| Label actions - Labeled by | Filters the graphs andmetrics by data rows that have been labeled by a specific labeler. |
| Label actions - Deleted | Filters the graphs and metrics by data rows based on their deletion status. You can either `Exclude` data rows with deleted labels or `Include` all labels created in the project. |
## Throughput, efficiency, and quality (TEQ)
This section provides three separate views to help you understand the performance of your labeling operation: Throughput, Efficiency, and Quality.
### Throughput view
The throughput view provides insight into the amount of labeling work being produced and helps you answer questions like:
* *How many assets were labeled in the last 30 days?*
* *What is the review time and rework time for labeled assets?*
* *What is the average amount of labeling work being produced?*
These metrics are available for all members of the project and for individual members. The throughput view displays the following charts:
| Chart | Description |
| ------------- | ----------------------------------------------------------------------------------------------------------------------------------------------------------------------------------------------------------------------------------------------- |
| Done | Displays the daily count of data rows in the *Done* step of the project workflow. See [Workflows](/docs/workflows) for more definitions. |
| Labels | Displays the count of labeled data rows, including labels that were later deleted. For Benchmark or Consensus data rows, a single data row can have multiple labels, so the Labels count may exceed the number of data rows in the same period. |
| Annotations | Displays the count of annotations created, including labels that wer later deleted. |
| Reviews | Count of "Approve" and "Reject" actions for labels created in the project. For information on approve and reject actions in the review queue, see [Workflows](/docs/workflows). |
| Total time | Displays the total time spent (inclusive of Labeling, Review and Rework time) on labels created in the project. |
| Labeling time | Displays the total *labeling time* spent on data rows, while the timer is on. |
| Review time | Displays the total *review time* spent on labeled data rows, while the timer is on. |
| Rework time | Displays the total *rework time* spent on labeled data rows, while the timer is on. |
#### Forecast
The forecast feature shows your average daily throughput and completed work (data rows, labels, reviews, annotations) and uses that to forecast completion dates. To see this, enable the **Forecast** toggle.
#### Average daily throughput
The **average daily throughput** is calculated by dividing the total units completed in the selected date range by the number of calendar days in that range.
Where:
* Total units completed = sum of the relevant throughput metric over the selected period (e.g., total labels created, total reviews, etc)
* Number of calendar days = inclusive of days between start and end date (e.g., Jan 1–Jan 7 → 7 days). This aligns the “average per day” with how the forecast projects completion over calendar time.
For example, if a project has 2,800 labels created over a 14-day window, the average daily throughput for labels would be 200 labels/day (2,800 labels / 14 days).
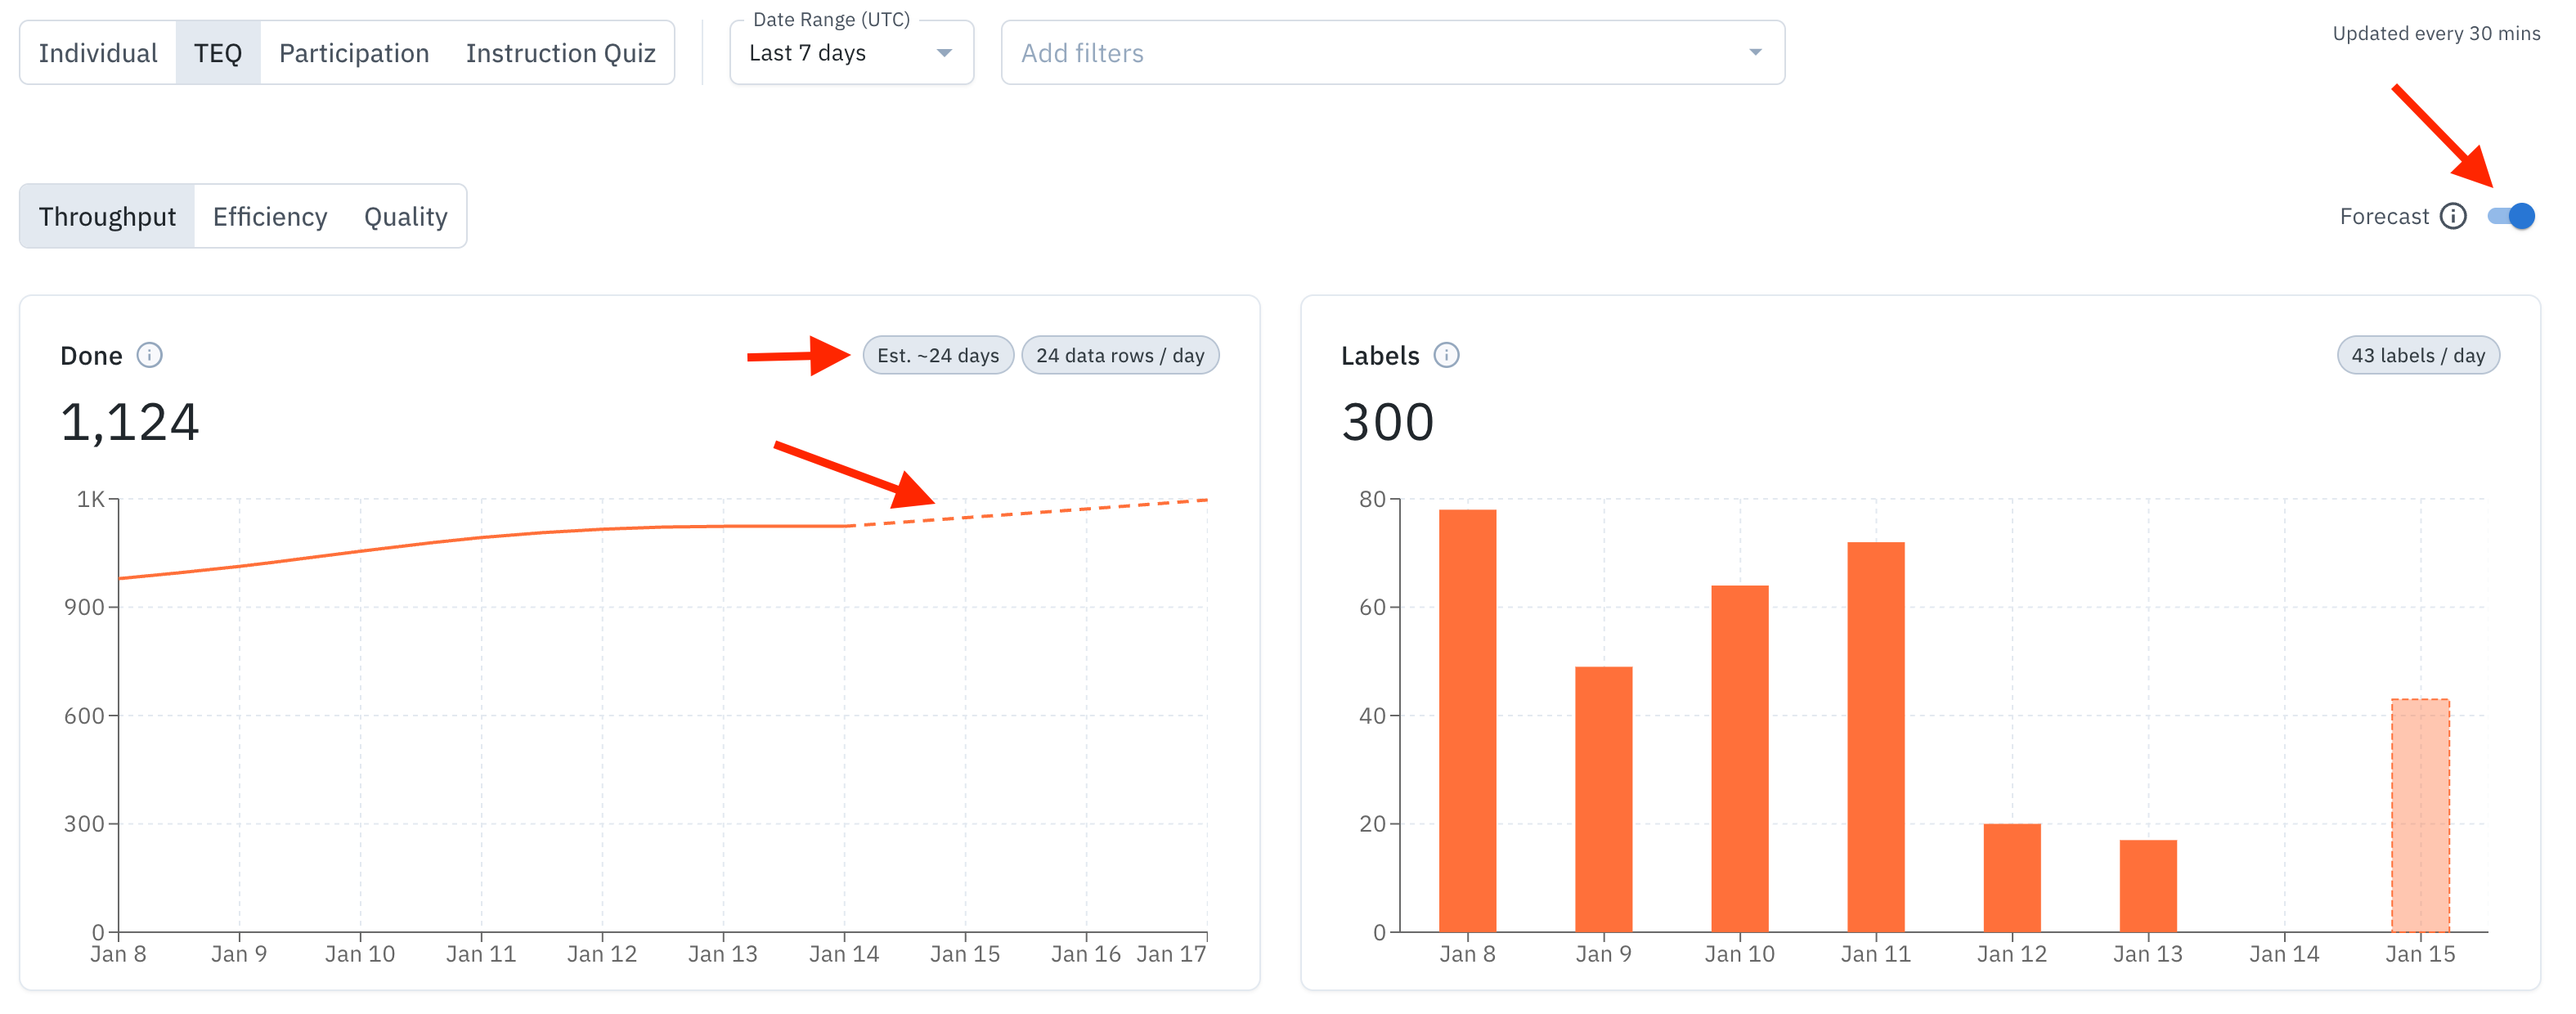 Note that metric units in this view can vary:
* For **Labels created / Reviews received / Annotations created**, average daily throughput is in units like “labels/day”, “reviews/day”, “annotations/day”.
* For **time-based metrics**, the forecast uses those as inputs, but the primary “average daily throughput” surfaced is for the count-based metrics (data rows/labels/reviews/annotations), per the spec and launch comms.
### Efficiency view
The efficiency view helps you visualize the time spent per unit of work, per labeled asset, or per review. These metrics help answer questions such as:
* *What is the average amount of time spent labeling an asset?*
* *How can I reduce the time spent per labeled asset?*
Note that metric units in this view can vary:
* For **Labels created / Reviews received / Annotations created**, average daily throughput is in units like “labels/day”, “reviews/day”, “annotations/day”.
* For **time-based metrics**, the forecast uses those as inputs, but the primary “average daily throughput” surfaced is for the count-based metrics (data rows/labels/reviews/annotations), per the spec and launch comms.
### Efficiency view
The efficiency view helps you visualize the time spent per unit of work, per labeled asset, or per review. These metrics help answer questions such as:
* *What is the average amount of time spent labeling an asset?*
* *How can I reduce the time spent per labeled asset?*
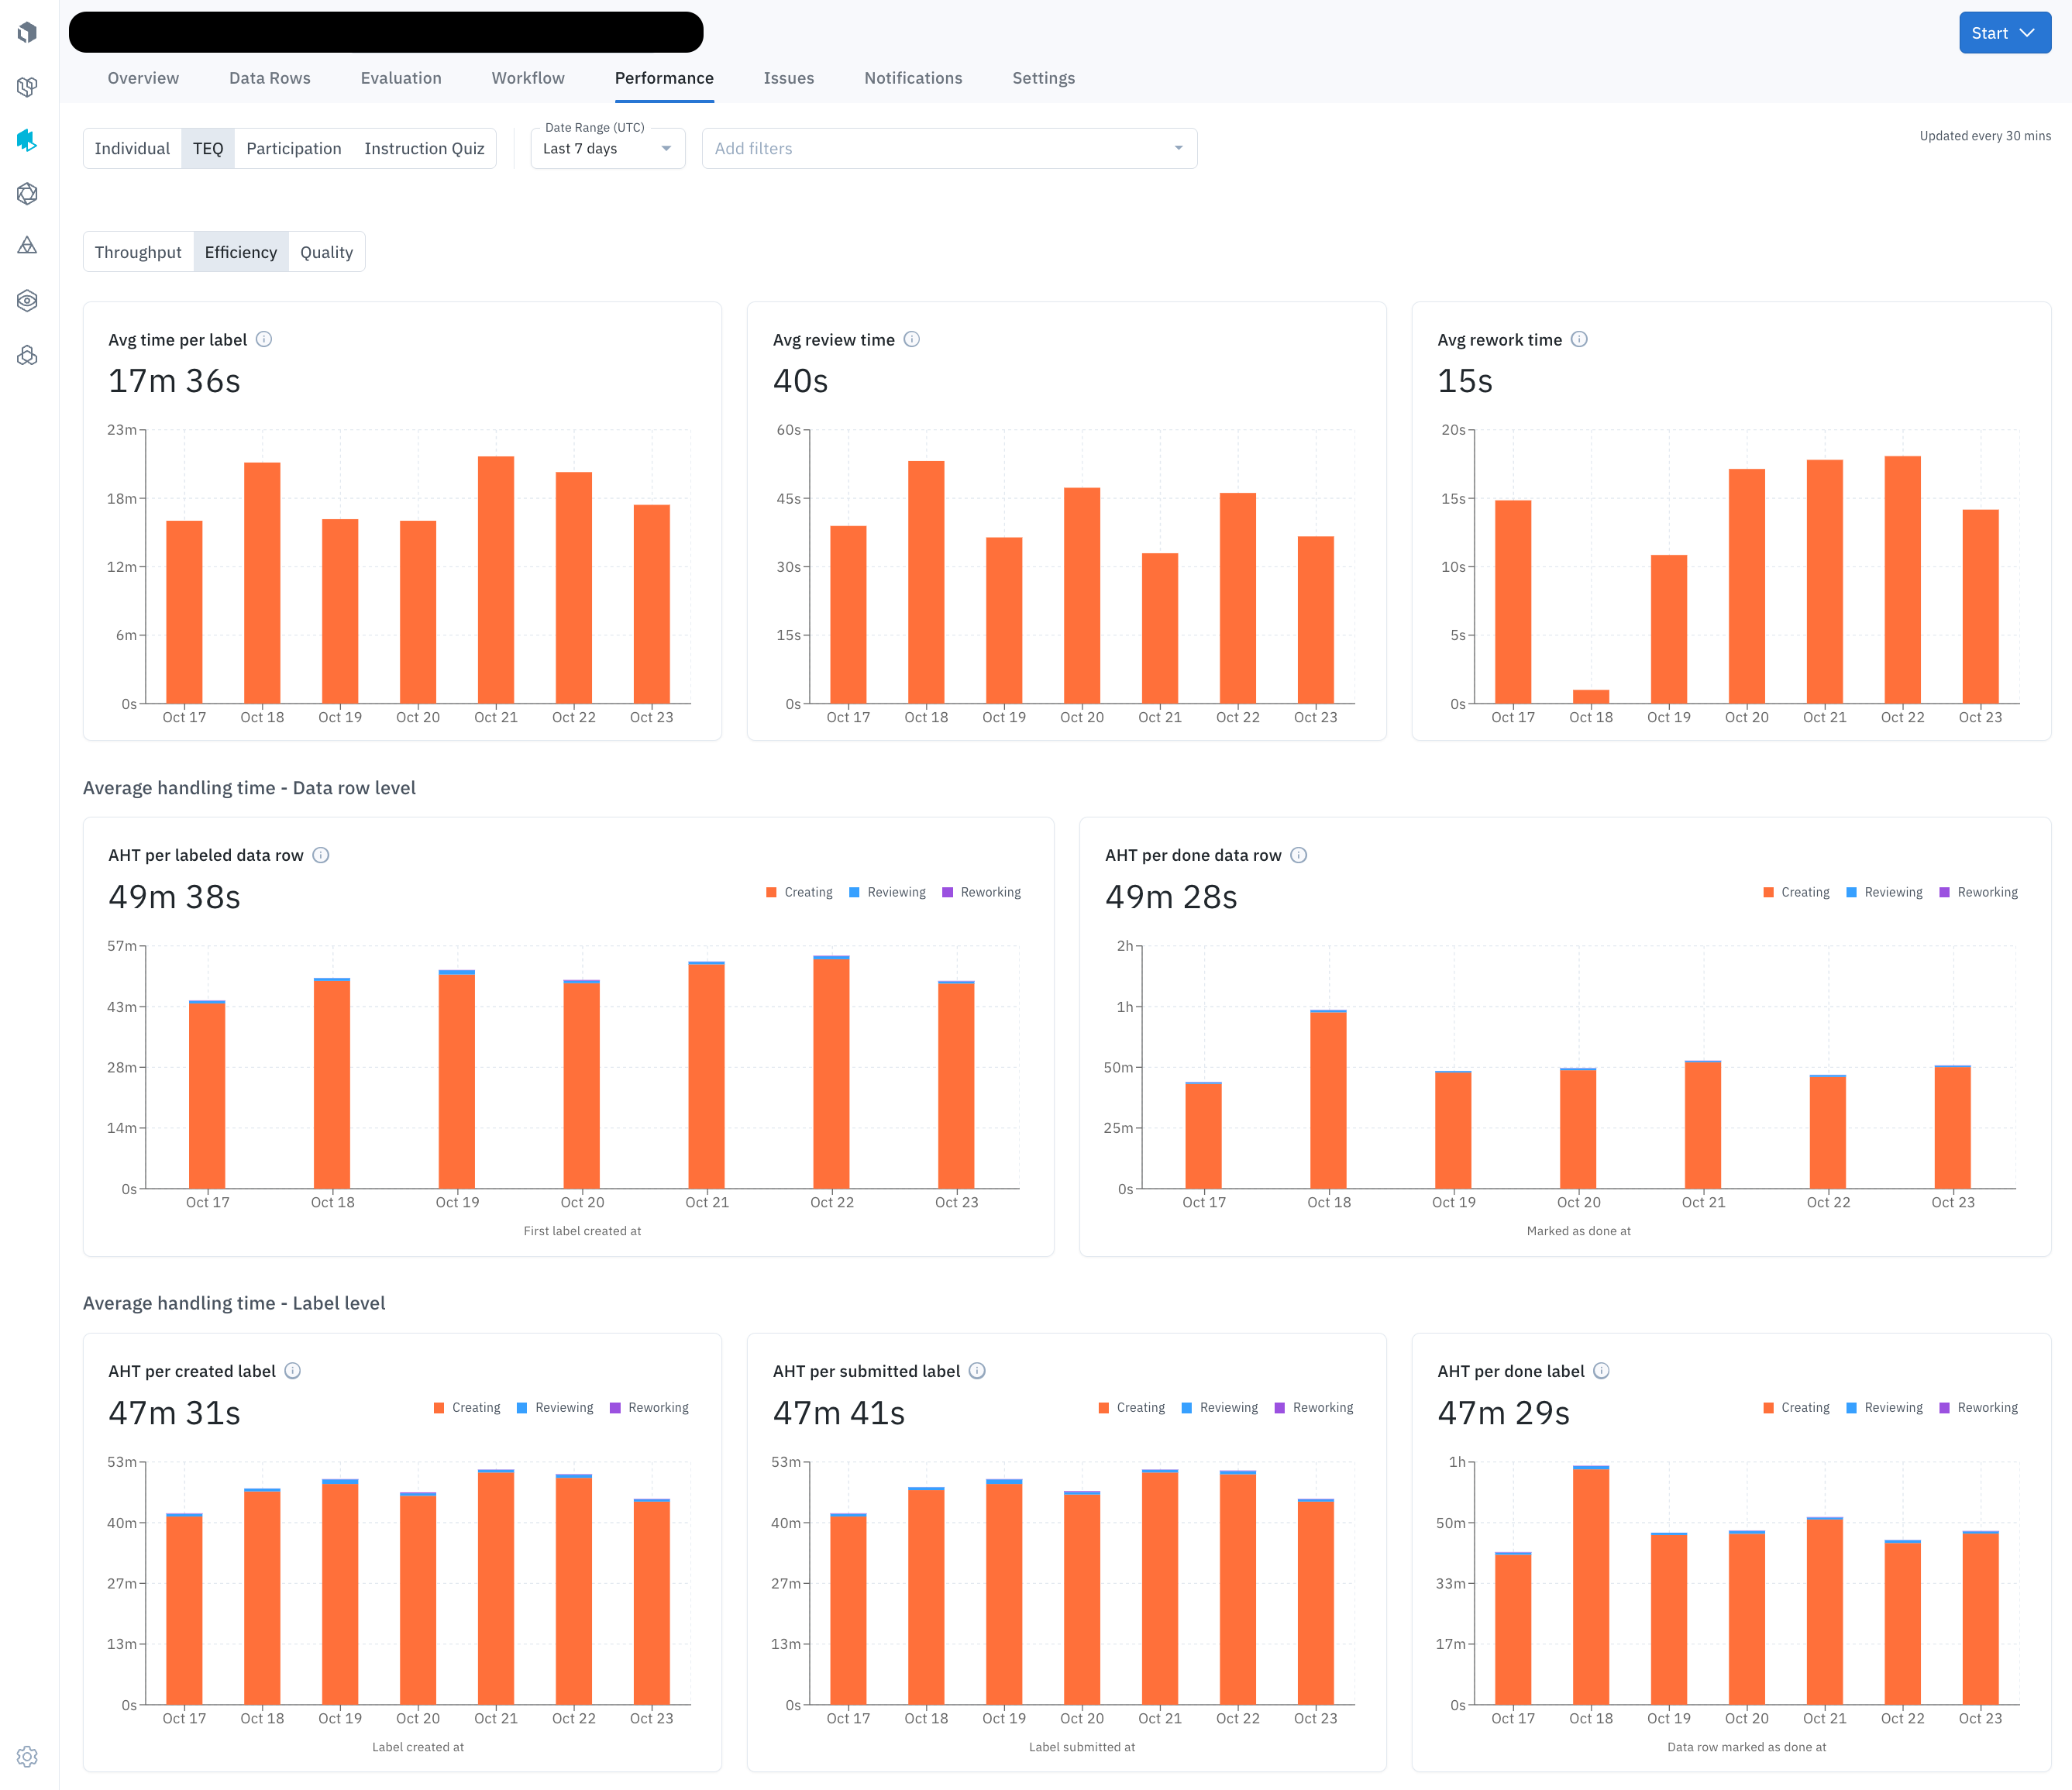 These metrics are available for individual project members and at the project level. The efficiency view includes these charts:
| Chart | Description |
| ------------------------ | ----------------------------------------------------------------------------------------------------------------------------- |
| Avg time per label | Displays the average *labeling time* spent per label. Avg time per label = Total labeling time / number of labels submitted |
| Avg review time | Displays the average *review time* per data row. Avg review time = Total review time / number of data rows reviewed |
| Avg rework time | Displays the average *rework time* per data row. Avg rework time = Total rework time / number of data rows reworked |
| AHT per labeled data row | Displays the total time across all modes for all data rows divided by the number of data rows. |
| AHT per done data row | Displays the total time across all modes for data rows in the ‘Done’ task queue divided by the number of data rows in ‘Done’. |
| AHT per created label | Displays the total time across all modes for ‘Created’ labels divided by the number of ‘Created’ labels. |
| AHT per submitted label | Displays the total time across all modes for ‘Submitted’ labels divided by the number of ‘Submitted’ labels |
| AHT per done label | Displays the total time across all modes for labels in the ‘Done’ task queue divided by the number of labels in ‘Done’. |
"Skipped" time is excluded from labeling time, and "abandoned" (unsaved) work is counted toward labeling time. You can use filters to include or exclude time spent on "deleted" labels.
### Quality view
The quality view helps you understand the accuracy and consistency of the labeling work being produced. These metrics answer questions like:
* *What is the average quality of a labeled asset?*
* *How can I ensure label quality is more consistent across the team?*
These metrics are available for individual project members and for the project as a whole. The quality view includes the following charts, which will only display if the corresponding features (Benchmark and Consensus) are enabled for your project:
| Metric | Description |
| ---------------------- | ----------------------------------------------------------------------------------------------------------------------------------------------------------------------------- |
| Benchmark | Shows the average benchmark scores on labeled data rows within a specified time frame. |
| Benchmark distribution | Shows a histogram of benchmark scores (grouped by 10) for labeled assets within a specified time frame. |
| Consensus | Shows the average consensus score of labeled assets over a selected period. This is the average agreement score of consensus labels within themselves (for a given data row). |
| Consensus distribution | Shows a histogram of consensus scores (grouped by 10) for labeled assets plotted over the selected period. |
## Individual member performance
Click **Individual** in the Performance dashboard to view individual metrics for each team member that has worked on the project. The performance metrics are separated by intent (**labeling** and **reviewing**) and are shown as distinct views in the table.
Team members are listed individually in separate rows and will only appear if they have actively performed tasks during the selected period.
### Labeling metrics
Here are the metrics displayed in the **Individual** → **Labeling** view.
| Metric (Labeling) | Description |
| ------------------------- | ---------------------------------------------------------------------------------------------------------------------------------------------------------------------------------------------------------------------------------------------------------------------------------- |
| Labels created | The number of labels created by team members during the selected period. |
| Labels skipped | The number of labels skipped by team members during the selected period. |
| Labeling time (submitted) | Total *labeling time* team member spent creating and submitting labels during the selected period. |
| Labeling time (skipped) | Total *labeling time* team member spent working on labels that were ultimately skipped. (The **Skip** button was clicked.) |
| Avg time per label | Average *labeling time* of submitted and skipped labels. Calculated by dividing total labeling time by the number of labels submitted or skipped. Displays *N/A* when no labels have been submitted or skipped. |
| Reviews received | The number of Workflow review queue actions (*Approve* and *Reject*) received during the selected period on data rows labeled by the team member. |
| Avg review time (all) | Average *review time* on labels created by the team member. Calculated by dividing the total *review time* for all team members by the number of labels that have been reviewed. |
| Avg rework time (all) | Average *rework time* on labels created by the team member. Calculated by dividing the total time spent by all team members and the number of labels reworked. |
| Rework time (all) | Total *rework time* spent on labels created by the team member in the selected period. |
| Review time (all) | Total *review time* spent on labels created by the team member during the selected period. |
| Rework % | Percentage of labels created by the team member that were reworked during the select time period. Calculated by dividing the number of labels created by the team member that had *any* rework done by the number of labels created by the team member. |
| Approval % | Percentage of data rows labeled by the team member that were approved during the selected period. Calculated by dividing the number of data rows with one or more approved labels by the number of review actions (*Approve* or *Reject*). Labels pending review are not included. |
| Benchmark score | Average agreement score with benchmark labels for labels created by the team member during the selected period. |
| Consensus score | Average agreement score with other consensus labels for labels created by the team member during the selected period. |
### Reviewing metrics
Here are the metrics displayed in the **Individual** → **Reviewing** view.
| Metric (Reviewing) | Description |
| ------------------ | ------------------------------------------------------------------------------------------------------------------------------------------------------------------------------------------------------------------------------------------------------------------------------------------------------------- |
| Data rows reviewed | Data rows that have had *review time* spent by the user (per filter selection). |
| Data rows reworked | Data rows that have had *rework time* spent by the user. |
| Avg review time | Average *review time* spent by the user in the period selected. Numerator = Total *review time* spent by the user Denominator = Number of labels reviewed by the user |
| Avg rework time | Average *rework time* spent by the user in the selected period. Numerator = Total rework time spent by the user Denominator = Number of labels reworked (approved or rejected) by the user |
| Total time | Sum of *review time* and *rework time* spent by the user during the period selected. |
| Rework % | Percentage (%) of data rows reviewed by the user that have been reworked. Numerator = Number of labels that have had both *rework time* and *review time* spent by the user. Denominator = Number of data rows that have had [*review time*](#review-time) spent by the user. |
| Approval % | Data rows with an *approve* action by the user as a percentage (%) of data rows with any review action by the user. Numerator = Number of data rows with *approve* action by the user (in workflow). Denominator = Number of data rows with either an *approve* or *reject* action by the user (in workflow). |
## Participation histogram
The **Participation** histogram is a chart in the Performance Dashboard that visualizes the distribution of labeler activity across a project.
These metrics are available for individual project members and at the project level. The efficiency view includes these charts:
| Chart | Description |
| ------------------------ | ----------------------------------------------------------------------------------------------------------------------------- |
| Avg time per label | Displays the average *labeling time* spent per label. Avg time per label = Total labeling time / number of labels submitted |
| Avg review time | Displays the average *review time* per data row. Avg review time = Total review time / number of data rows reviewed |
| Avg rework time | Displays the average *rework time* per data row. Avg rework time = Total rework time / number of data rows reworked |
| AHT per labeled data row | Displays the total time across all modes for all data rows divided by the number of data rows. |
| AHT per done data row | Displays the total time across all modes for data rows in the ‘Done’ task queue divided by the number of data rows in ‘Done’. |
| AHT per created label | Displays the total time across all modes for ‘Created’ labels divided by the number of ‘Created’ labels. |
| AHT per submitted label | Displays the total time across all modes for ‘Submitted’ labels divided by the number of ‘Submitted’ labels |
| AHT per done label | Displays the total time across all modes for labels in the ‘Done’ task queue divided by the number of labels in ‘Done’. |
"Skipped" time is excluded from labeling time, and "abandoned" (unsaved) work is counted toward labeling time. You can use filters to include or exclude time spent on "deleted" labels.
### Quality view
The quality view helps you understand the accuracy and consistency of the labeling work being produced. These metrics answer questions like:
* *What is the average quality of a labeled asset?*
* *How can I ensure label quality is more consistent across the team?*
These metrics are available for individual project members and for the project as a whole. The quality view includes the following charts, which will only display if the corresponding features (Benchmark and Consensus) are enabled for your project:
| Metric | Description |
| ---------------------- | ----------------------------------------------------------------------------------------------------------------------------------------------------------------------------- |
| Benchmark | Shows the average benchmark scores on labeled data rows within a specified time frame. |
| Benchmark distribution | Shows a histogram of benchmark scores (grouped by 10) for labeled assets within a specified time frame. |
| Consensus | Shows the average consensus score of labeled assets over a selected period. This is the average agreement score of consensus labels within themselves (for a given data row). |
| Consensus distribution | Shows a histogram of consensus scores (grouped by 10) for labeled assets plotted over the selected period. |
## Individual member performance
Click **Individual** in the Performance dashboard to view individual metrics for each team member that has worked on the project. The performance metrics are separated by intent (**labeling** and **reviewing**) and are shown as distinct views in the table.
Team members are listed individually in separate rows and will only appear if they have actively performed tasks during the selected period.
### Labeling metrics
Here are the metrics displayed in the **Individual** → **Labeling** view.
| Metric (Labeling) | Description |
| ------------------------- | ---------------------------------------------------------------------------------------------------------------------------------------------------------------------------------------------------------------------------------------------------------------------------------- |
| Labels created | The number of labels created by team members during the selected period. |
| Labels skipped | The number of labels skipped by team members during the selected period. |
| Labeling time (submitted) | Total *labeling time* team member spent creating and submitting labels during the selected period. |
| Labeling time (skipped) | Total *labeling time* team member spent working on labels that were ultimately skipped. (The **Skip** button was clicked.) |
| Avg time per label | Average *labeling time* of submitted and skipped labels. Calculated by dividing total labeling time by the number of labels submitted or skipped. Displays *N/A* when no labels have been submitted or skipped. |
| Reviews received | The number of Workflow review queue actions (*Approve* and *Reject*) received during the selected period on data rows labeled by the team member. |
| Avg review time (all) | Average *review time* on labels created by the team member. Calculated by dividing the total *review time* for all team members by the number of labels that have been reviewed. |
| Avg rework time (all) | Average *rework time* on labels created by the team member. Calculated by dividing the total time spent by all team members and the number of labels reworked. |
| Rework time (all) | Total *rework time* spent on labels created by the team member in the selected period. |
| Review time (all) | Total *review time* spent on labels created by the team member during the selected period. |
| Rework % | Percentage of labels created by the team member that were reworked during the select time period. Calculated by dividing the number of labels created by the team member that had *any* rework done by the number of labels created by the team member. |
| Approval % | Percentage of data rows labeled by the team member that were approved during the selected period. Calculated by dividing the number of data rows with one or more approved labels by the number of review actions (*Approve* or *Reject*). Labels pending review are not included. |
| Benchmark score | Average agreement score with benchmark labels for labels created by the team member during the selected period. |
| Consensus score | Average agreement score with other consensus labels for labels created by the team member during the selected period. |
### Reviewing metrics
Here are the metrics displayed in the **Individual** → **Reviewing** view.
| Metric (Reviewing) | Description |
| ------------------ | ------------------------------------------------------------------------------------------------------------------------------------------------------------------------------------------------------------------------------------------------------------------------------------------------------------- |
| Data rows reviewed | Data rows that have had *review time* spent by the user (per filter selection). |
| Data rows reworked | Data rows that have had *rework time* spent by the user. |
| Avg review time | Average *review time* spent by the user in the period selected. Numerator = Total *review time* spent by the user Denominator = Number of labels reviewed by the user |
| Avg rework time | Average *rework time* spent by the user in the selected period. Numerator = Total rework time spent by the user Denominator = Number of labels reworked (approved or rejected) by the user |
| Total time | Sum of *review time* and *rework time* spent by the user during the period selected. |
| Rework % | Percentage (%) of data rows reviewed by the user that have been reworked. Numerator = Number of labels that have had both *rework time* and *review time* spent by the user. Denominator = Number of data rows that have had [*review time*](#review-time) spent by the user. |
| Approval % | Data rows with an *approve* action by the user as a percentage (%) of data rows with any review action by the user. Numerator = Number of data rows with *approve* action by the user (in workflow). Denominator = Number of data rows with either an *approve* or *reject* action by the user (in workflow). |
## Participation histogram
The **Participation** histogram is a chart in the Performance Dashboard that visualizes the distribution of labeler activity across a project.
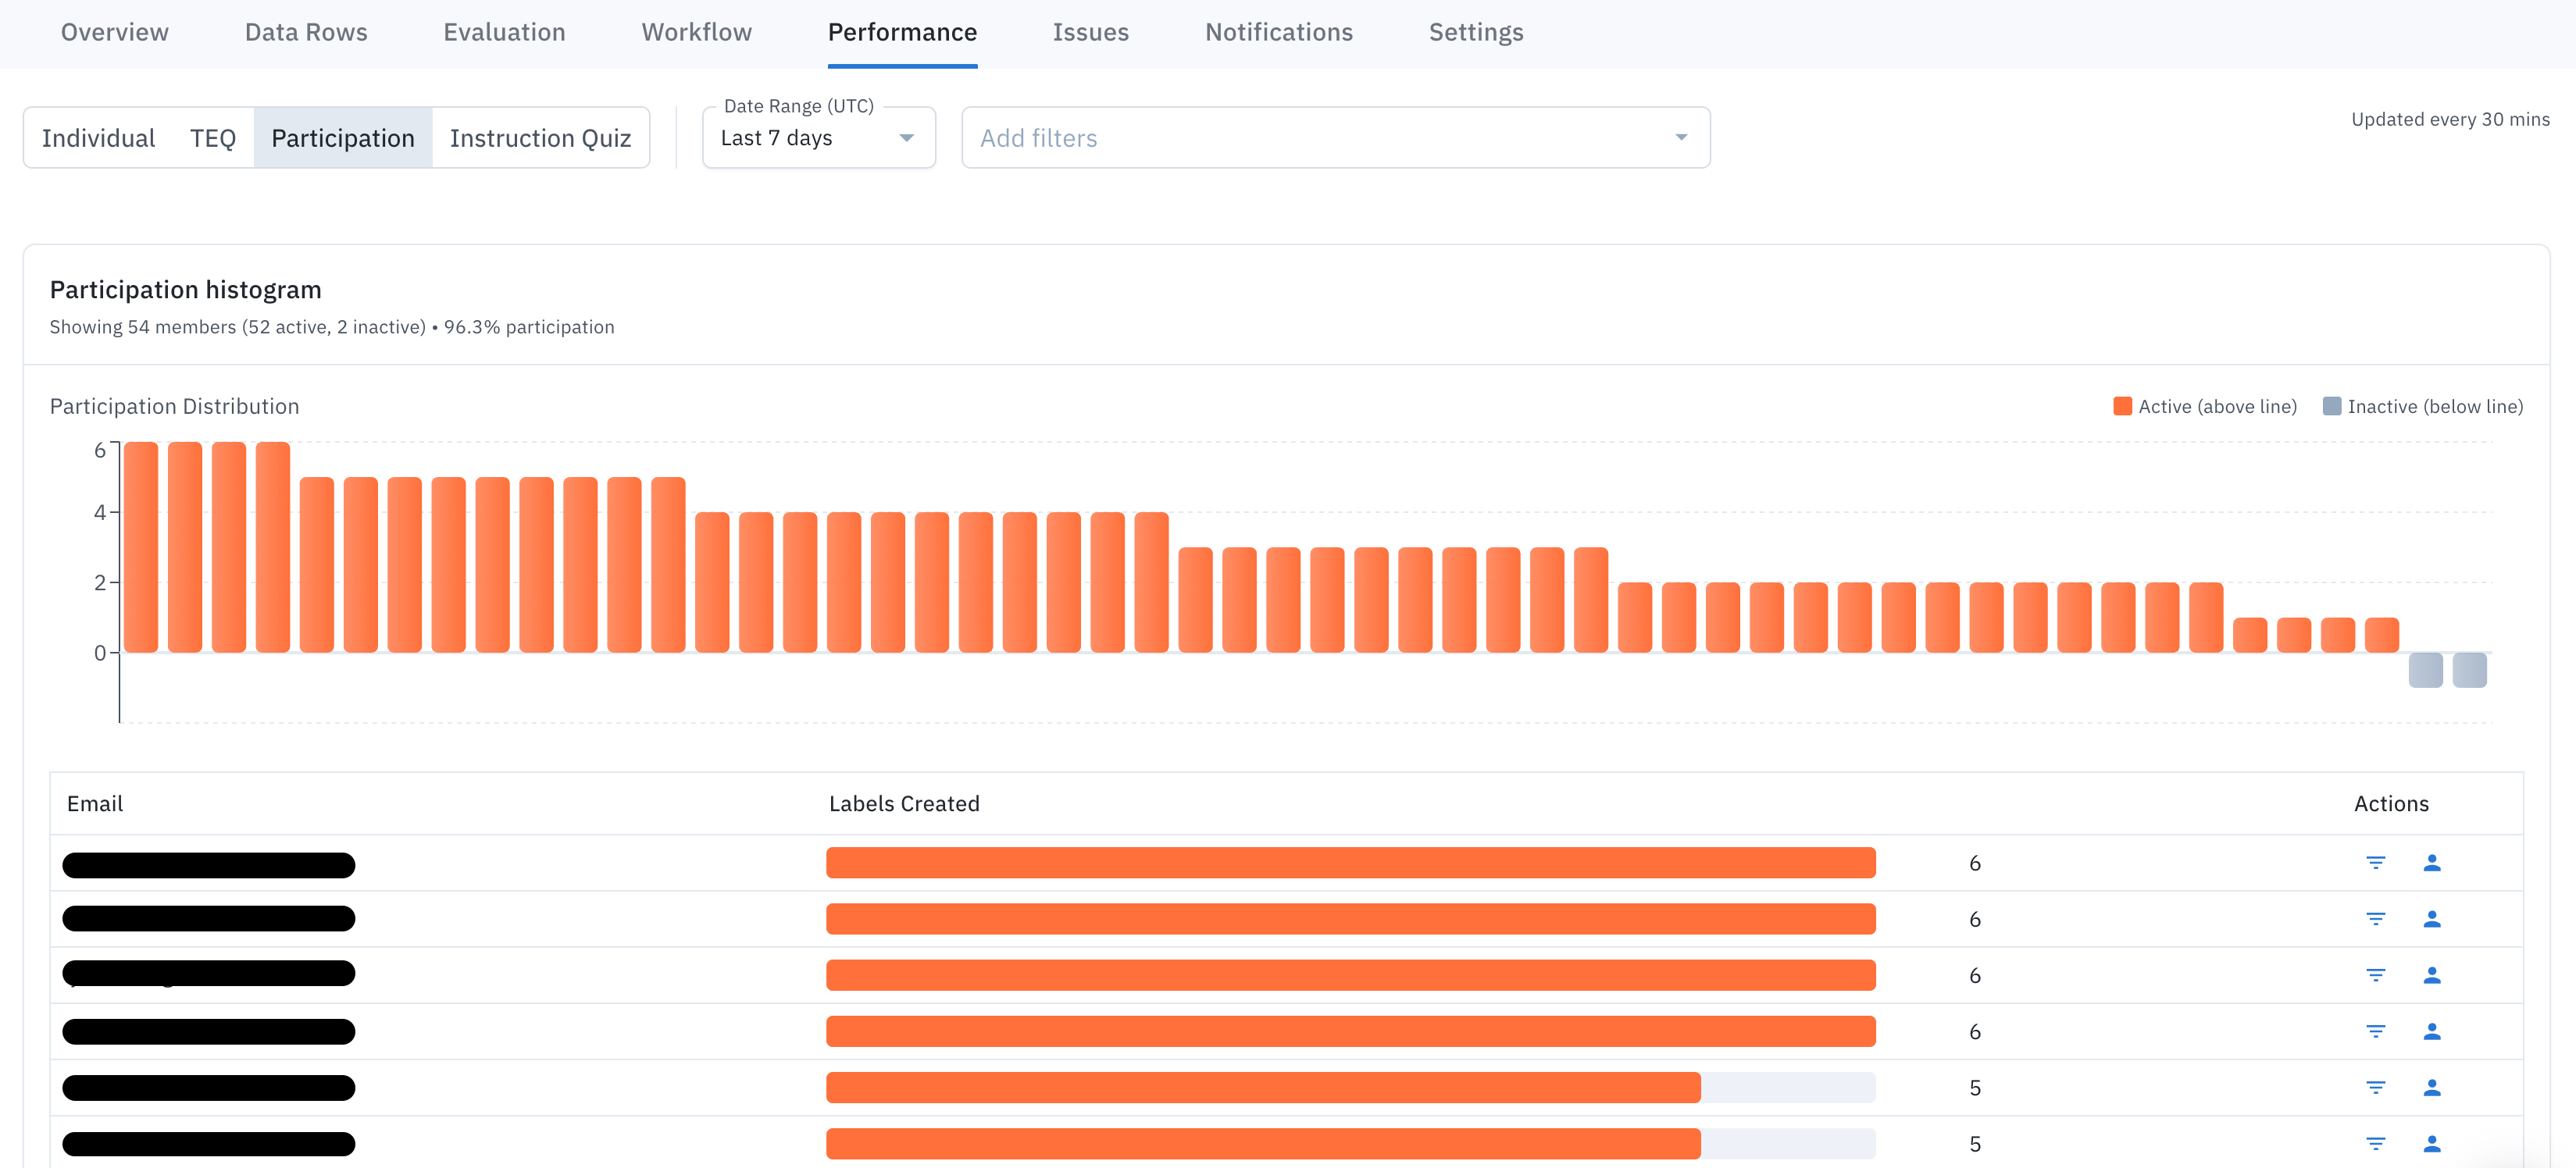 Specifically, it shows:
* How many labelers fall into different activity buckets (e.g., by number of tasks completed or labels created)
* It helps admins see at a glance whether participation is concentrated among a few heavy contributors or spread evenly across the workforce
This is distinct from aggregate throughput charts — rather than showing total output over time, it shows the *spread* of engagement across individual contributors. It's useful for identifying:
* Labelers who haven't participated at all
* Labelers who are highly active vs. barely active
* Overall workforce engagement health for a project
## Timer details
To help you measure efficiency, the timer log tracks how much time is spent on each data row. The time is broken down into three categories: labeling, reviewing, and reworking.
### How time is tracked in your project
A data row goes through many different states, which are tracked in the timer log.
| Type of timer | When it is tracked |
| :------------ | :--------------------------------------------------------------------------------------------------------------------------------------------------------------------------------------------------------------------------------------------- |
| Labeling time | This is the time the **original labeler** spends creating the label. It starts when they open an asset and stops when they **skip** or **submit** it. It also includes any time the original labeler spends going back to edit their own work. |
| Review time | This is the time a **different user** (not the original labeler) spends looking at a label in either the data row browser or the review queue. |
| Rework time | This is the time a **different user** spends fixing a label. It's tracked when they **submit** an asset from the rework queue, or when they **edit and save/approve/reject** the asset from the main data row view. |
Important notes
* **Inactivity Pause:** If a user is inactive for more than five minutes, the timer will automatically pause. It will resume as soon as they become active again.
* **Consensus and Benchmarks:** If your project uses consensus or benchmarks, the time recorded for a data row will be the total time spent across *all* labels created for that data row.
### How importing labels impacts the timer
Importing labels affects labeling time. When you import:
* **Ground truth labels:** No label time is recorded on the **Data rows** tab or the performance dashboard for that label. Label time is displayed as zero (0). When team members modify the label, time is recorded as review time.
* **Model-assisted learning (MAL) pre-labels:** No label time is recorded on the **Data rows** tab or the performance dashboard for that label. Label time is displayed as zero (0). When team members open the data row in the editor and click **Edit**, the time spent before selecting **Skip** or **Submit** is recorded as labeling time.
Specifically, it shows:
* How many labelers fall into different activity buckets (e.g., by number of tasks completed or labels created)
* It helps admins see at a glance whether participation is concentrated among a few heavy contributors or spread evenly across the workforce
This is distinct from aggregate throughput charts — rather than showing total output over time, it shows the *spread* of engagement across individual contributors. It's useful for identifying:
* Labelers who haven't participated at all
* Labelers who are highly active vs. barely active
* Overall workforce engagement health for a project
## Timer details
To help you measure efficiency, the timer log tracks how much time is spent on each data row. The time is broken down into three categories: labeling, reviewing, and reworking.
### How time is tracked in your project
A data row goes through many different states, which are tracked in the timer log.
| Type of timer | When it is tracked |
| :------------ | :--------------------------------------------------------------------------------------------------------------------------------------------------------------------------------------------------------------------------------------------- |
| Labeling time | This is the time the **original labeler** spends creating the label. It starts when they open an asset and stops when they **skip** or **submit** it. It also includes any time the original labeler spends going back to edit their own work. |
| Review time | This is the time a **different user** (not the original labeler) spends looking at a label in either the data row browser or the review queue. |
| Rework time | This is the time a **different user** spends fixing a label. It's tracked when they **submit** an asset from the rework queue, or when they **edit and save/approve/reject** the asset from the main data row view. |
Important notes
* **Inactivity Pause:** If a user is inactive for more than five minutes, the timer will automatically pause. It will resume as soon as they become active again.
* **Consensus and Benchmarks:** If your project uses consensus or benchmarks, the time recorded for a data row will be the total time spent across *all* labels created for that data row.
### How importing labels impacts the timer
Importing labels affects labeling time. When you import:
* **Ground truth labels:** No label time is recorded on the **Data rows** tab or the performance dashboard for that label. Label time is displayed as zero (0). When team members modify the label, time is recorded as review time.
* **Model-assisted learning (MAL) pre-labels:** No label time is recorded on the **Data rows** tab or the performance dashboard for that label. Label time is displayed as zero (0). When team members open the data row in the editor and click **Edit**, the time spent before selecting **Skip** or **Submit** is recorded as labeling time.