Filter data by split
By default, when opening a model run, you see all the data it contains under All training data. You can then display only the data corresponding to a specific split by clicking on Splits and then clicking on the split you care about: Train, Validation, or Test. Data rows that are in the model run but that are not assigned to any split will show up under All training data, but not under any split.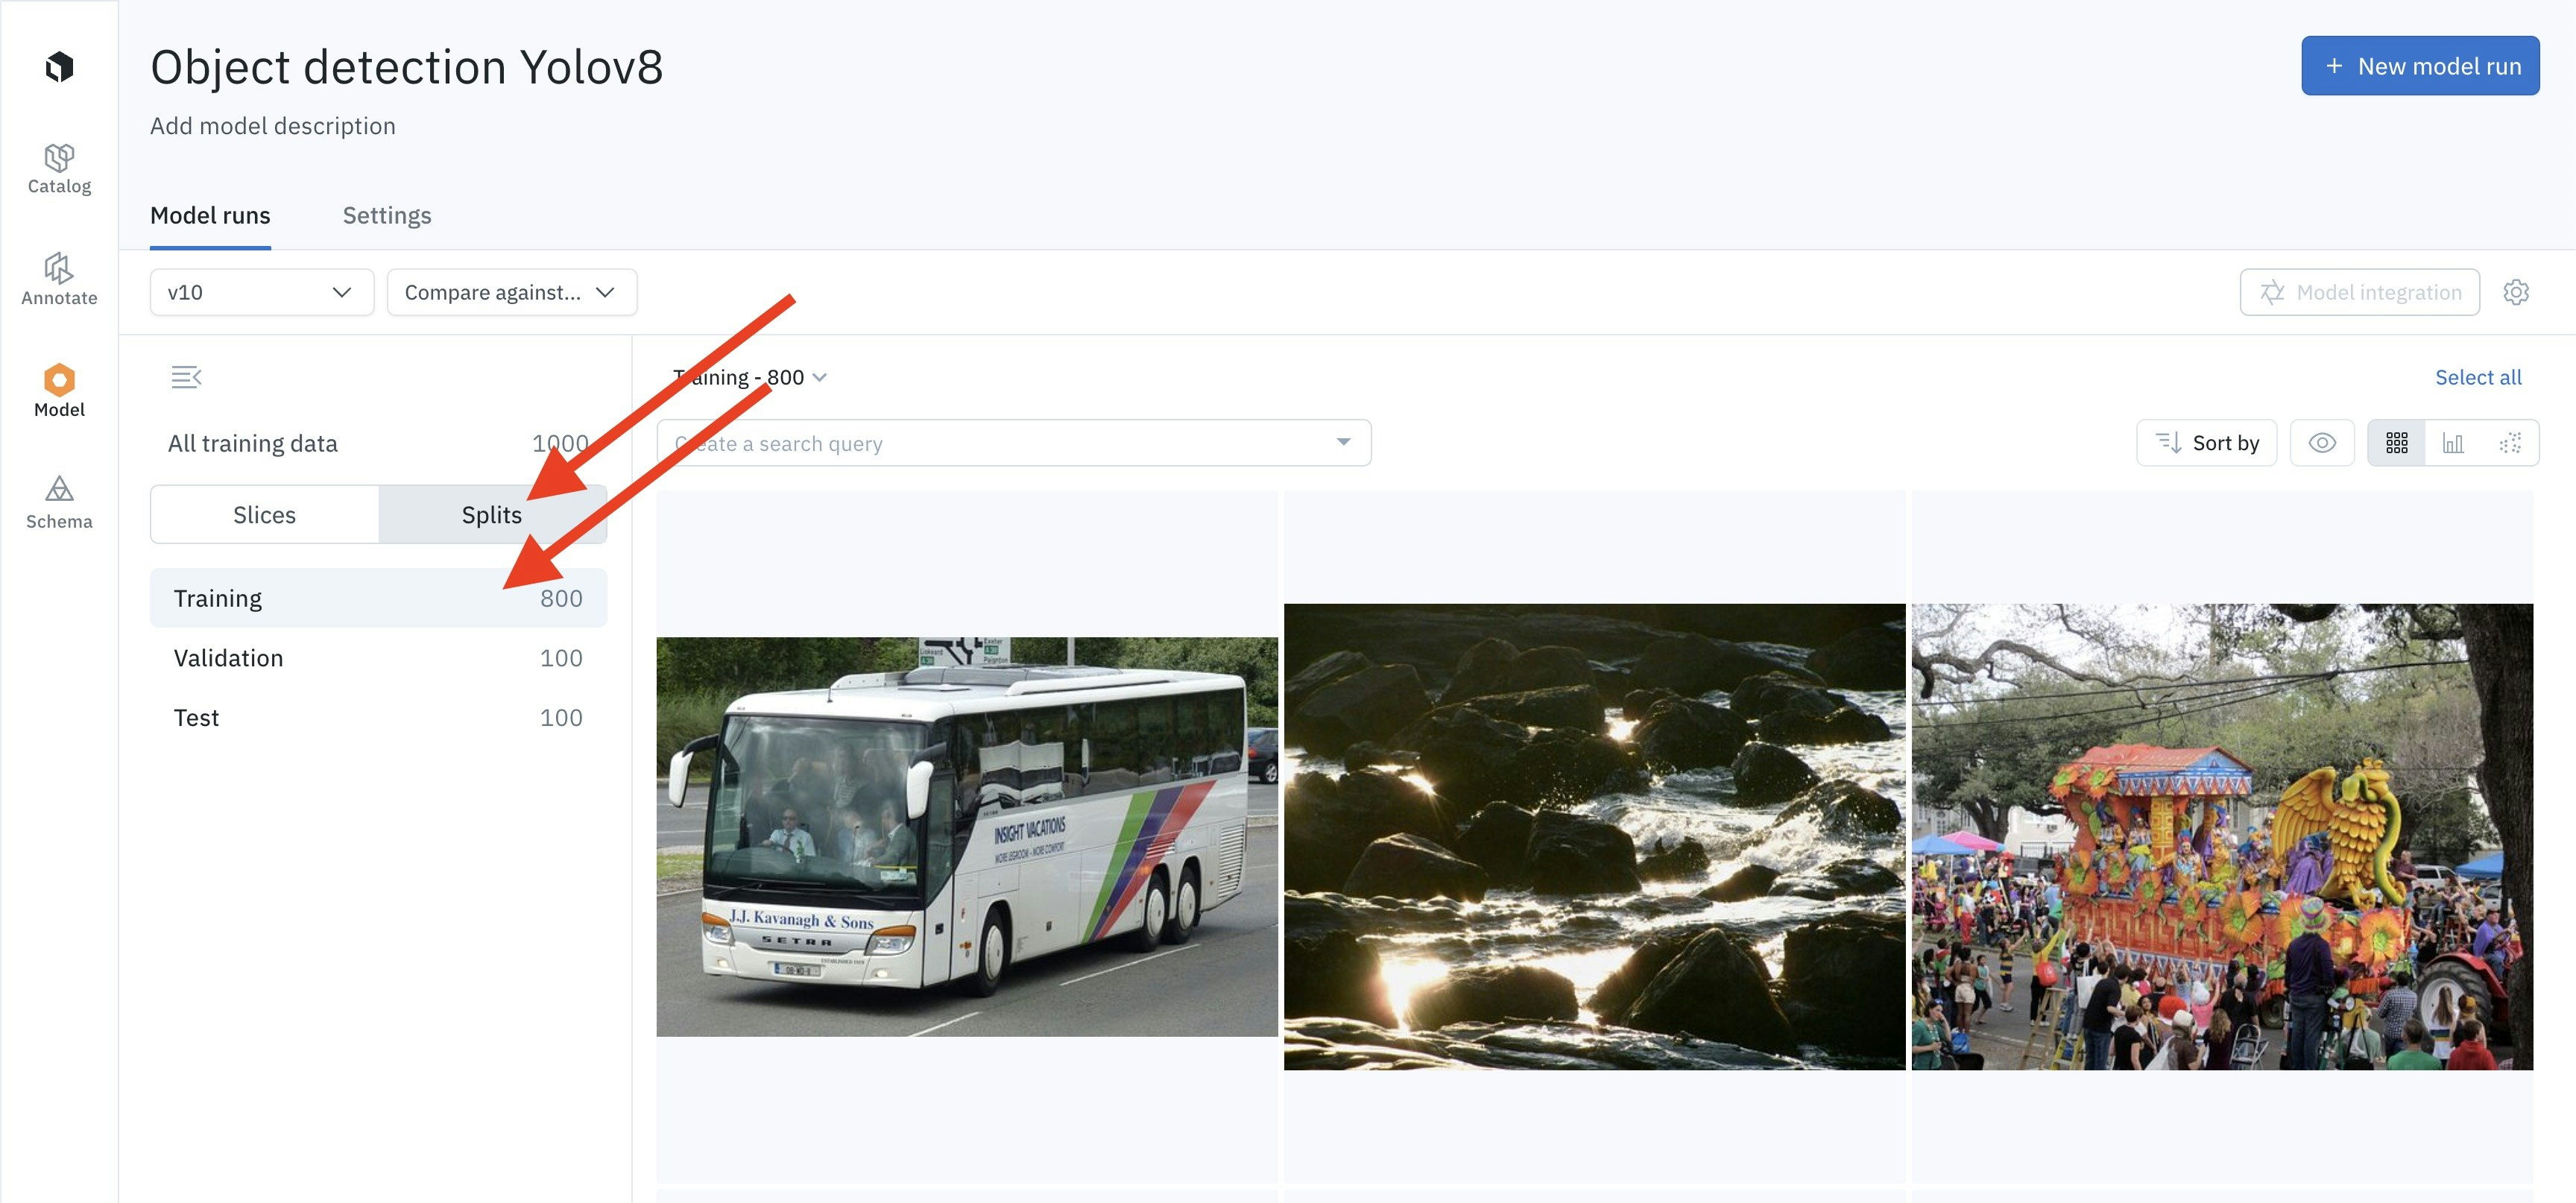
Visualize the distribution of your data by split
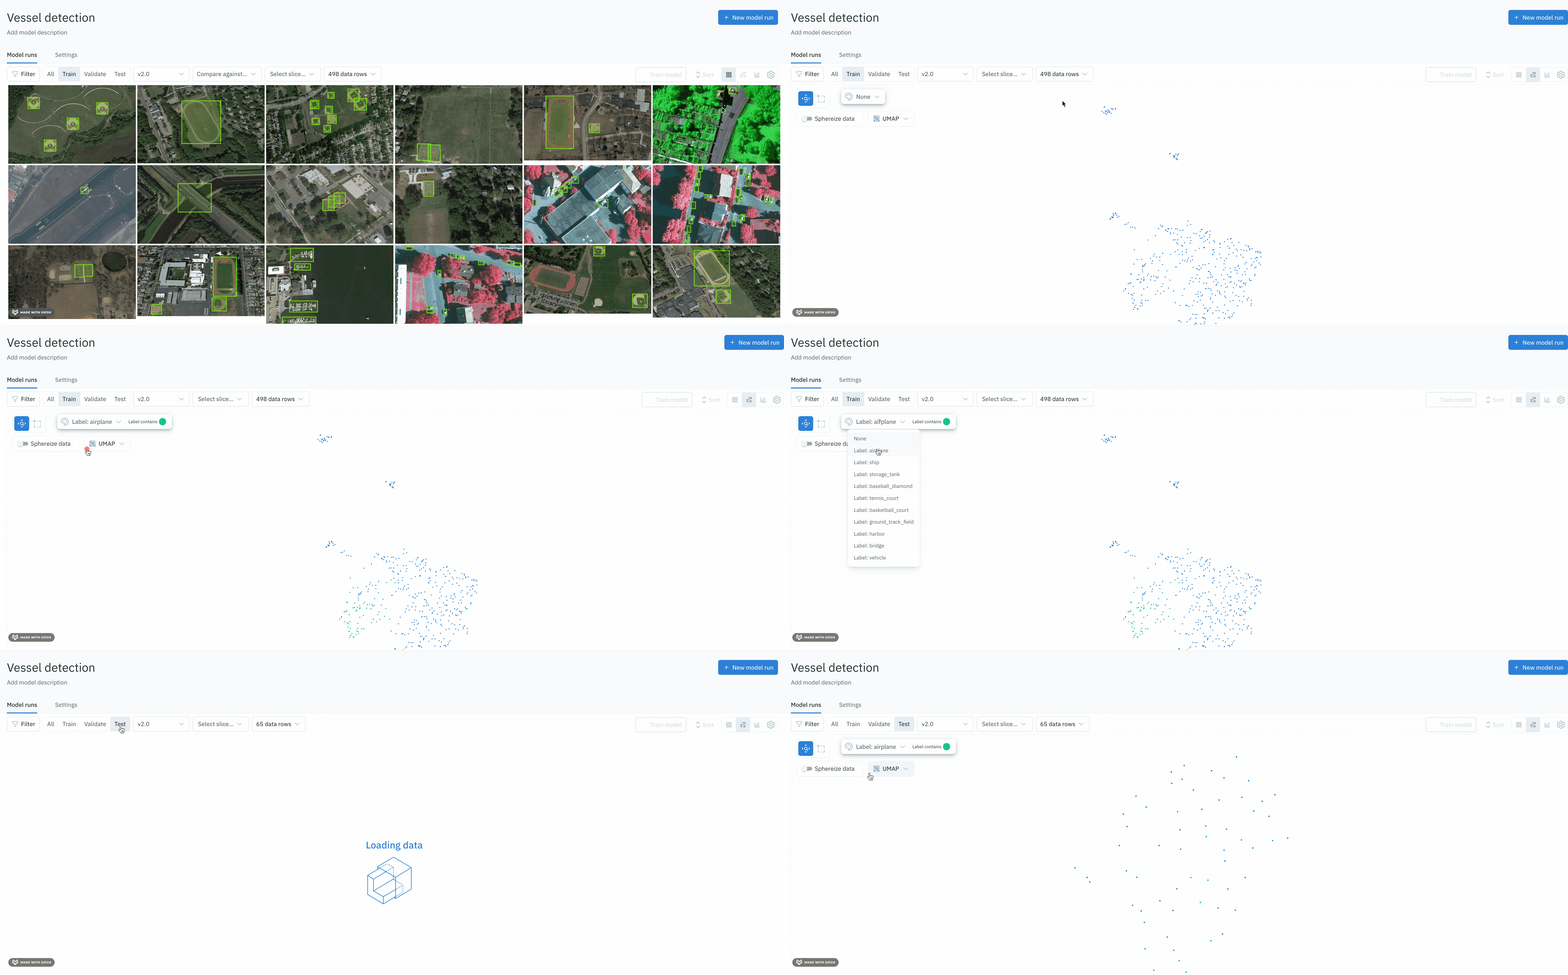
You can visualize the distribution of your data in each data split in the projector view. This helps assess whether data splits share a similar distribution.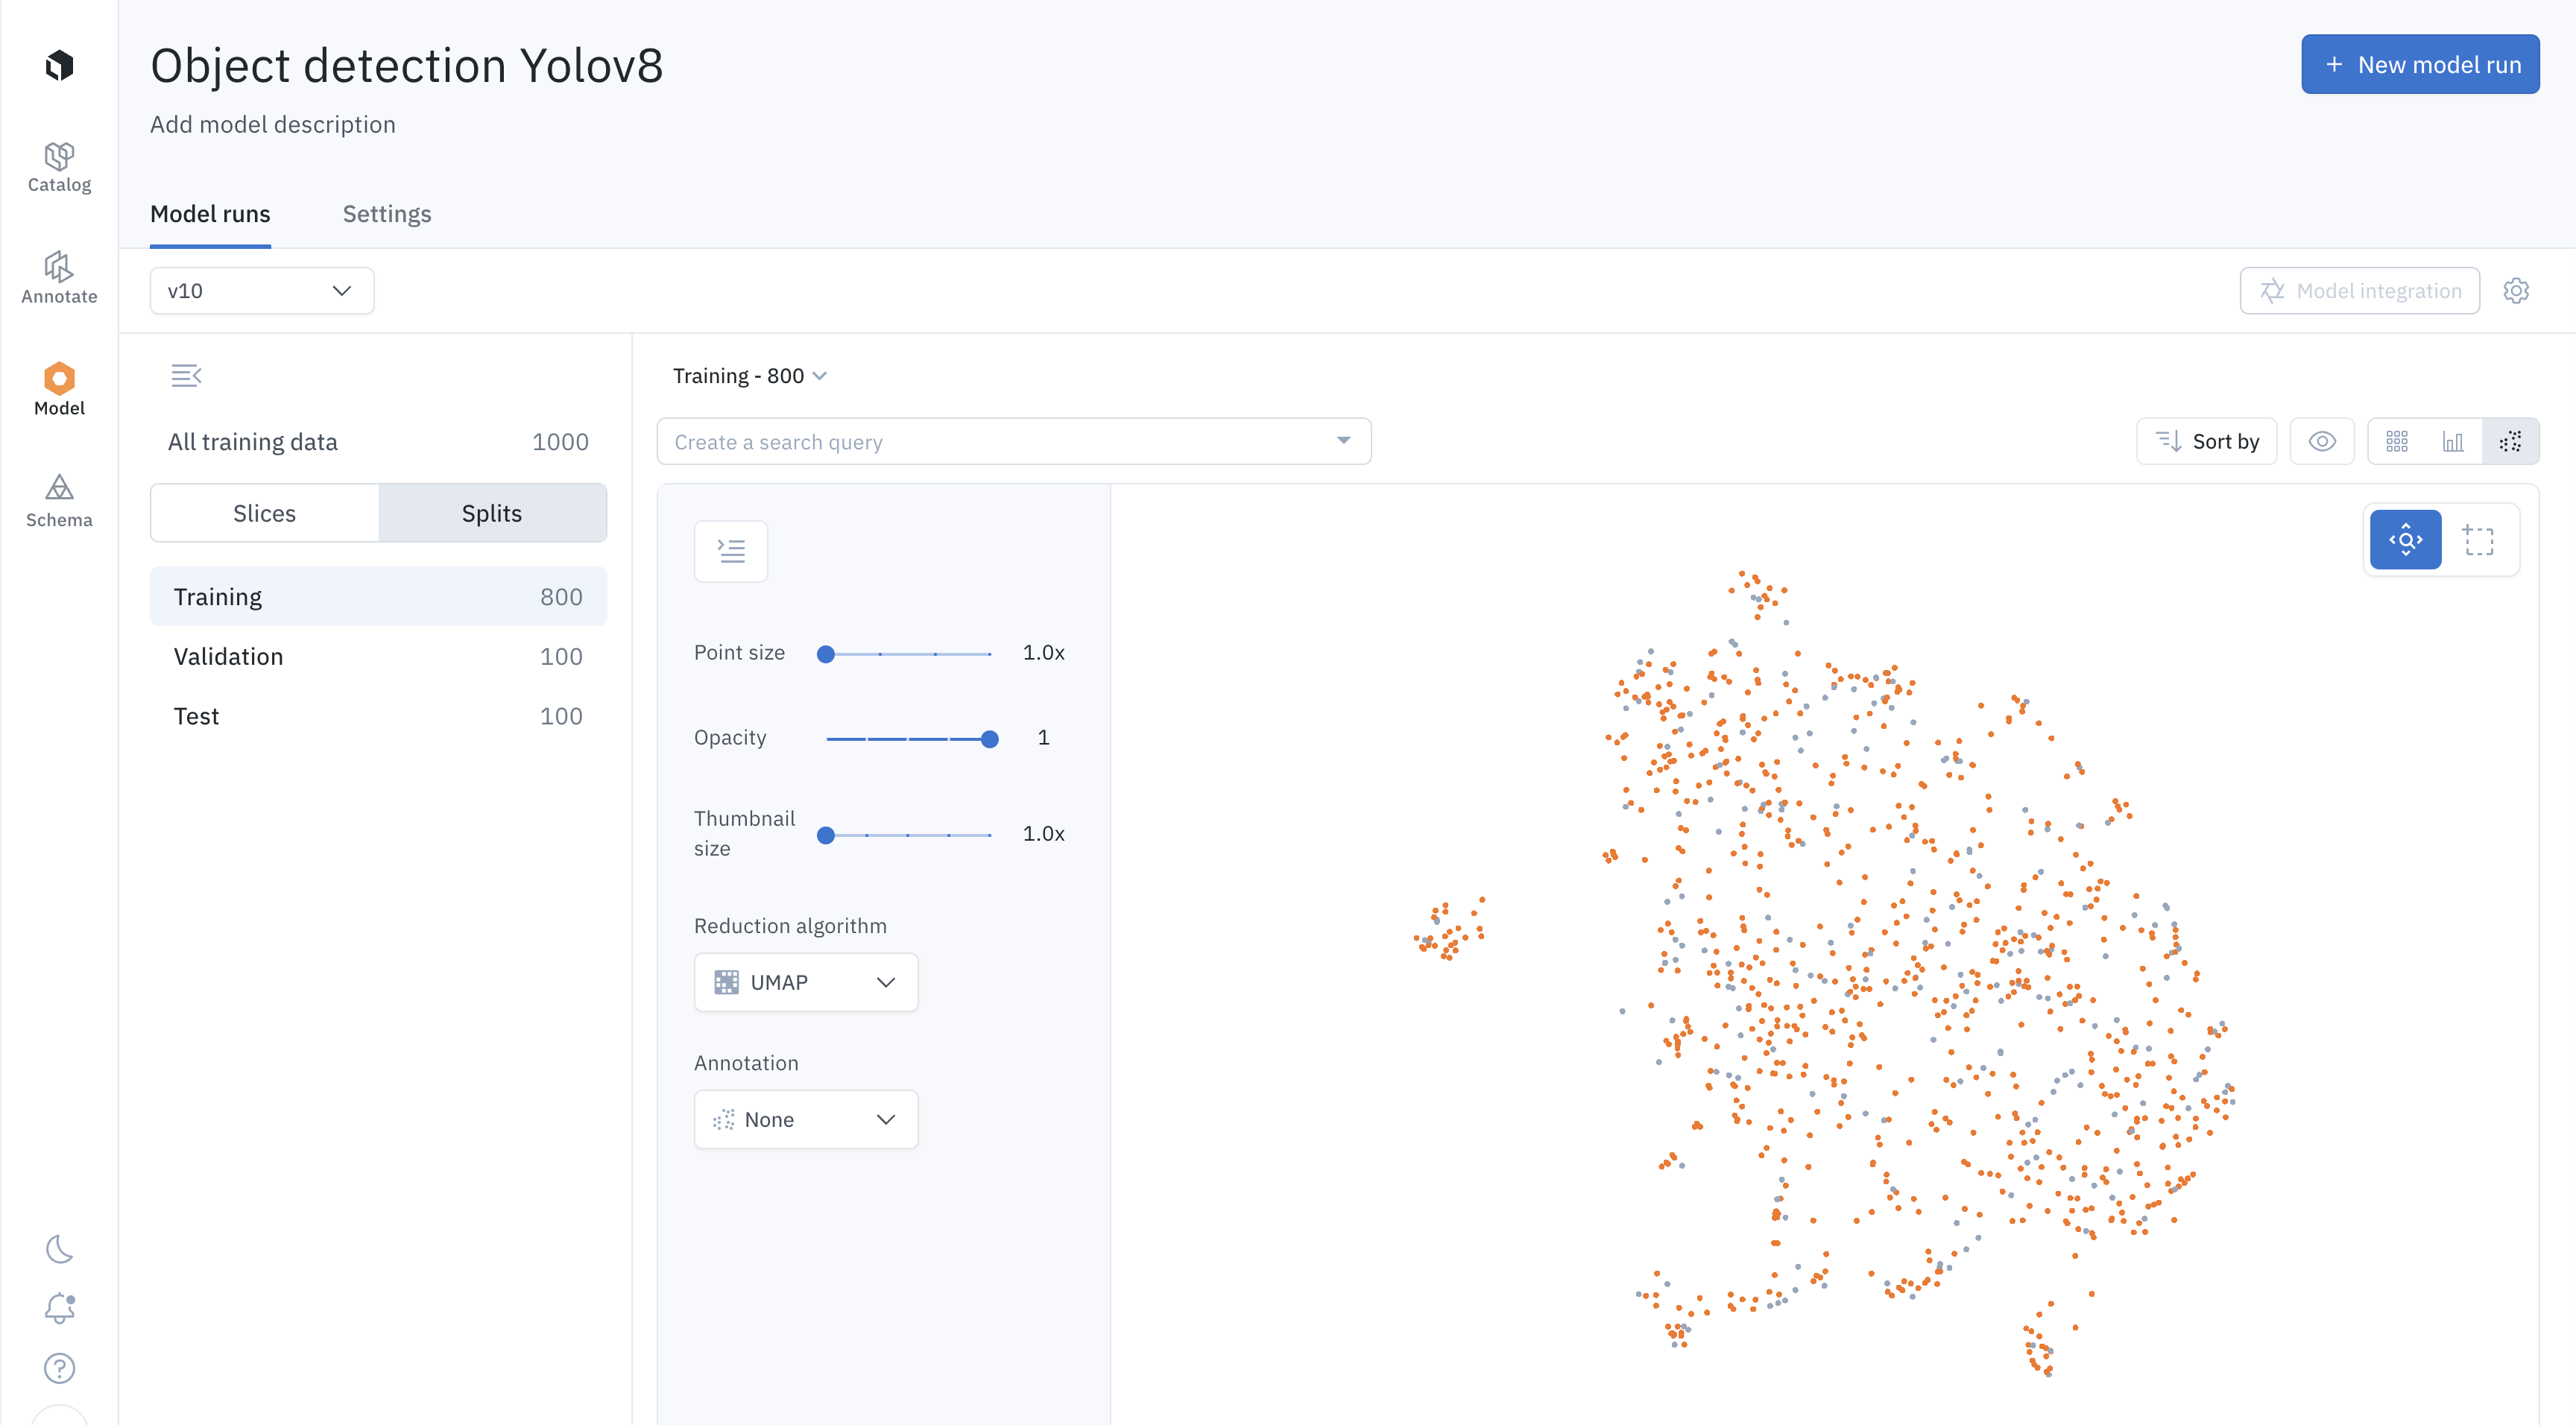
Configure data splits
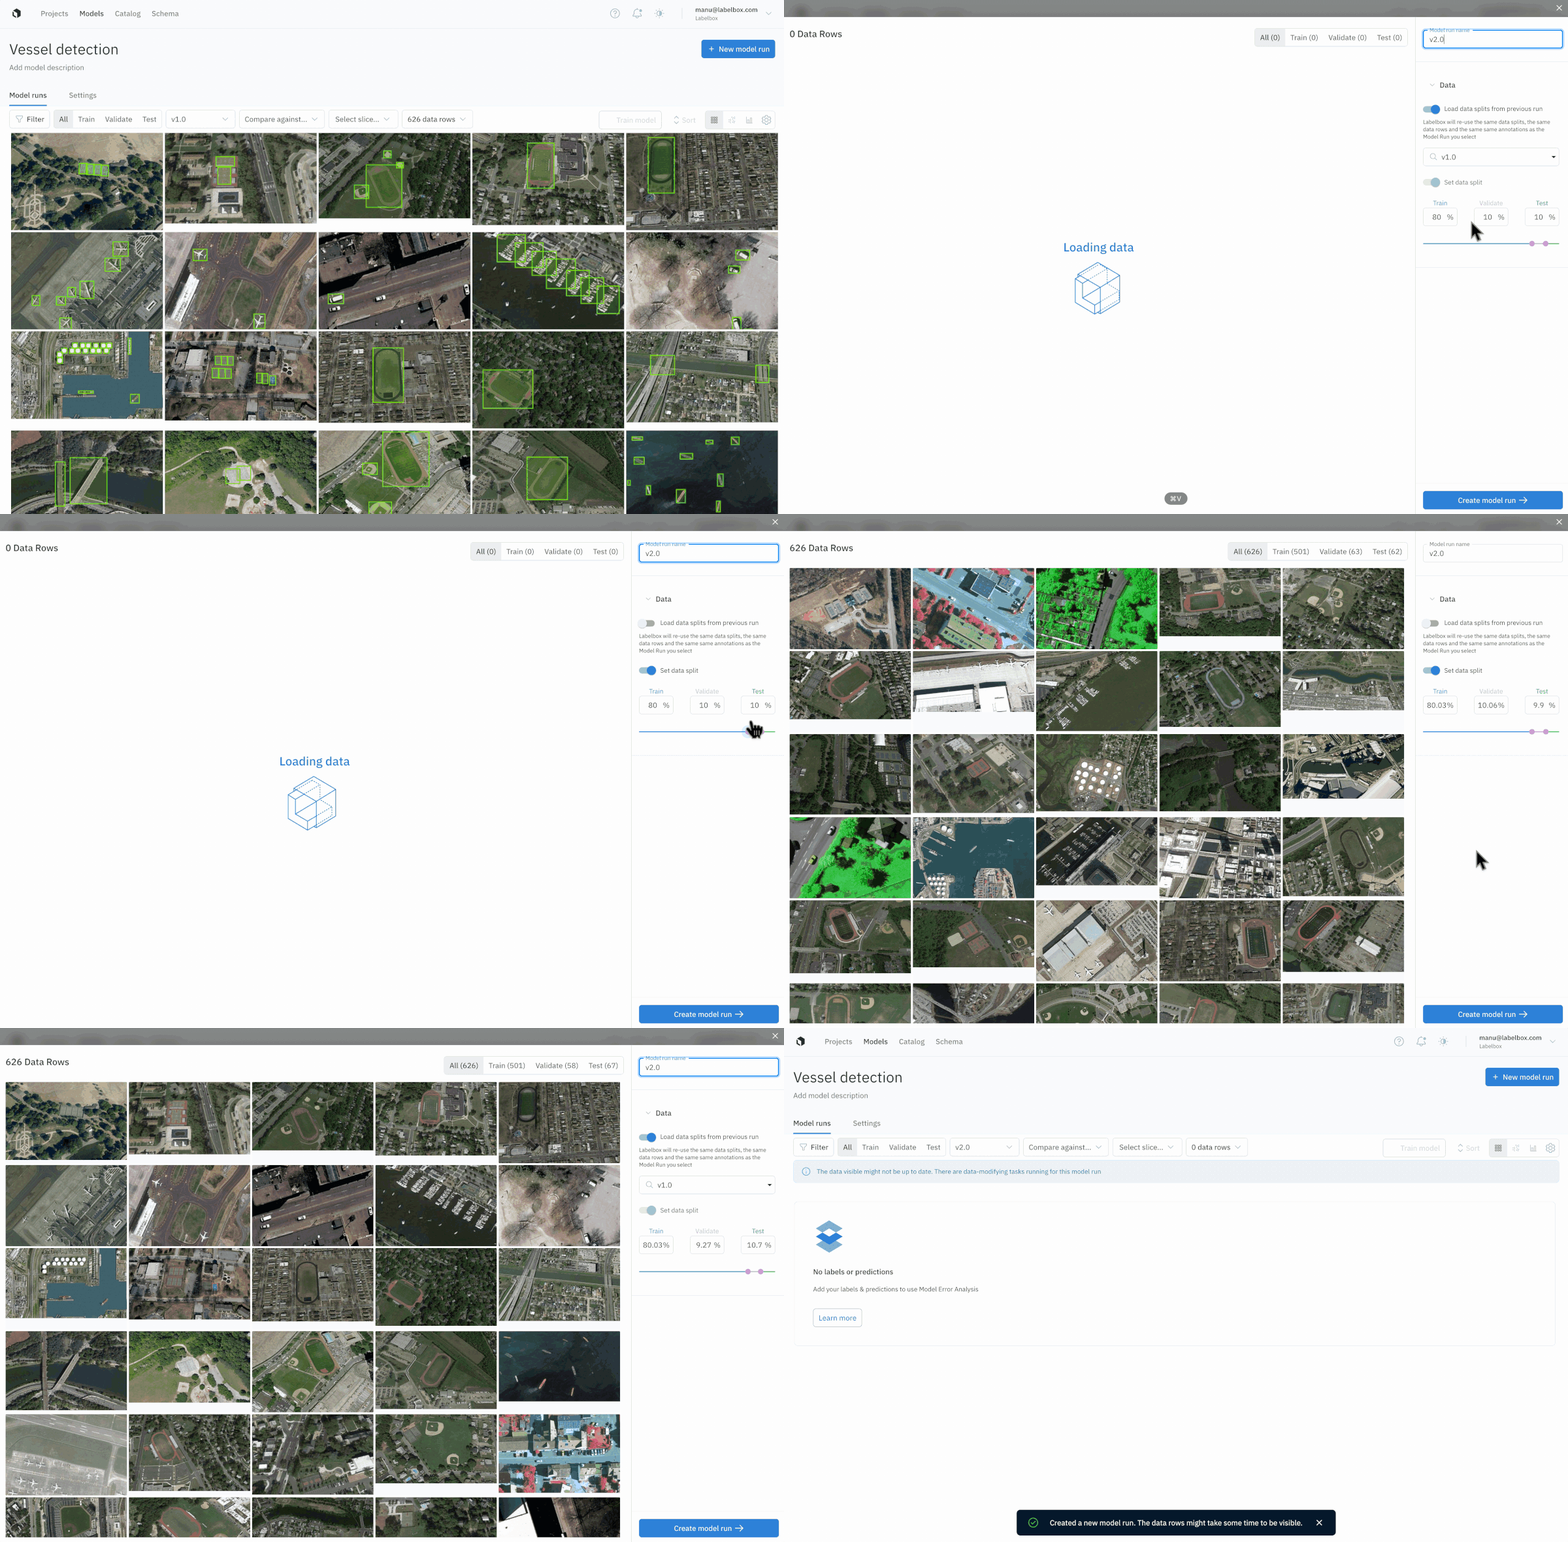
Once you have created a model run inside a model, the model run will access all the data rows selected for training from the experiment step. From here, you can configure the train, validation, and test splits.- The default data split is 80% training, 10% validation, and 10% testing. You can adjust the data splits by using the slider or typing in the input field. If you have a previous model run within the model directory, you can choose to load from the previous config. You also need to name the model run, such as “model iteration 1”.
- Now, you should be able to see the annotations on the train, validation, and test splits (you might need to wait for a few seconds and refresh it for the UI to finish loading all data rows). From here, you can view the annotations from each data split.
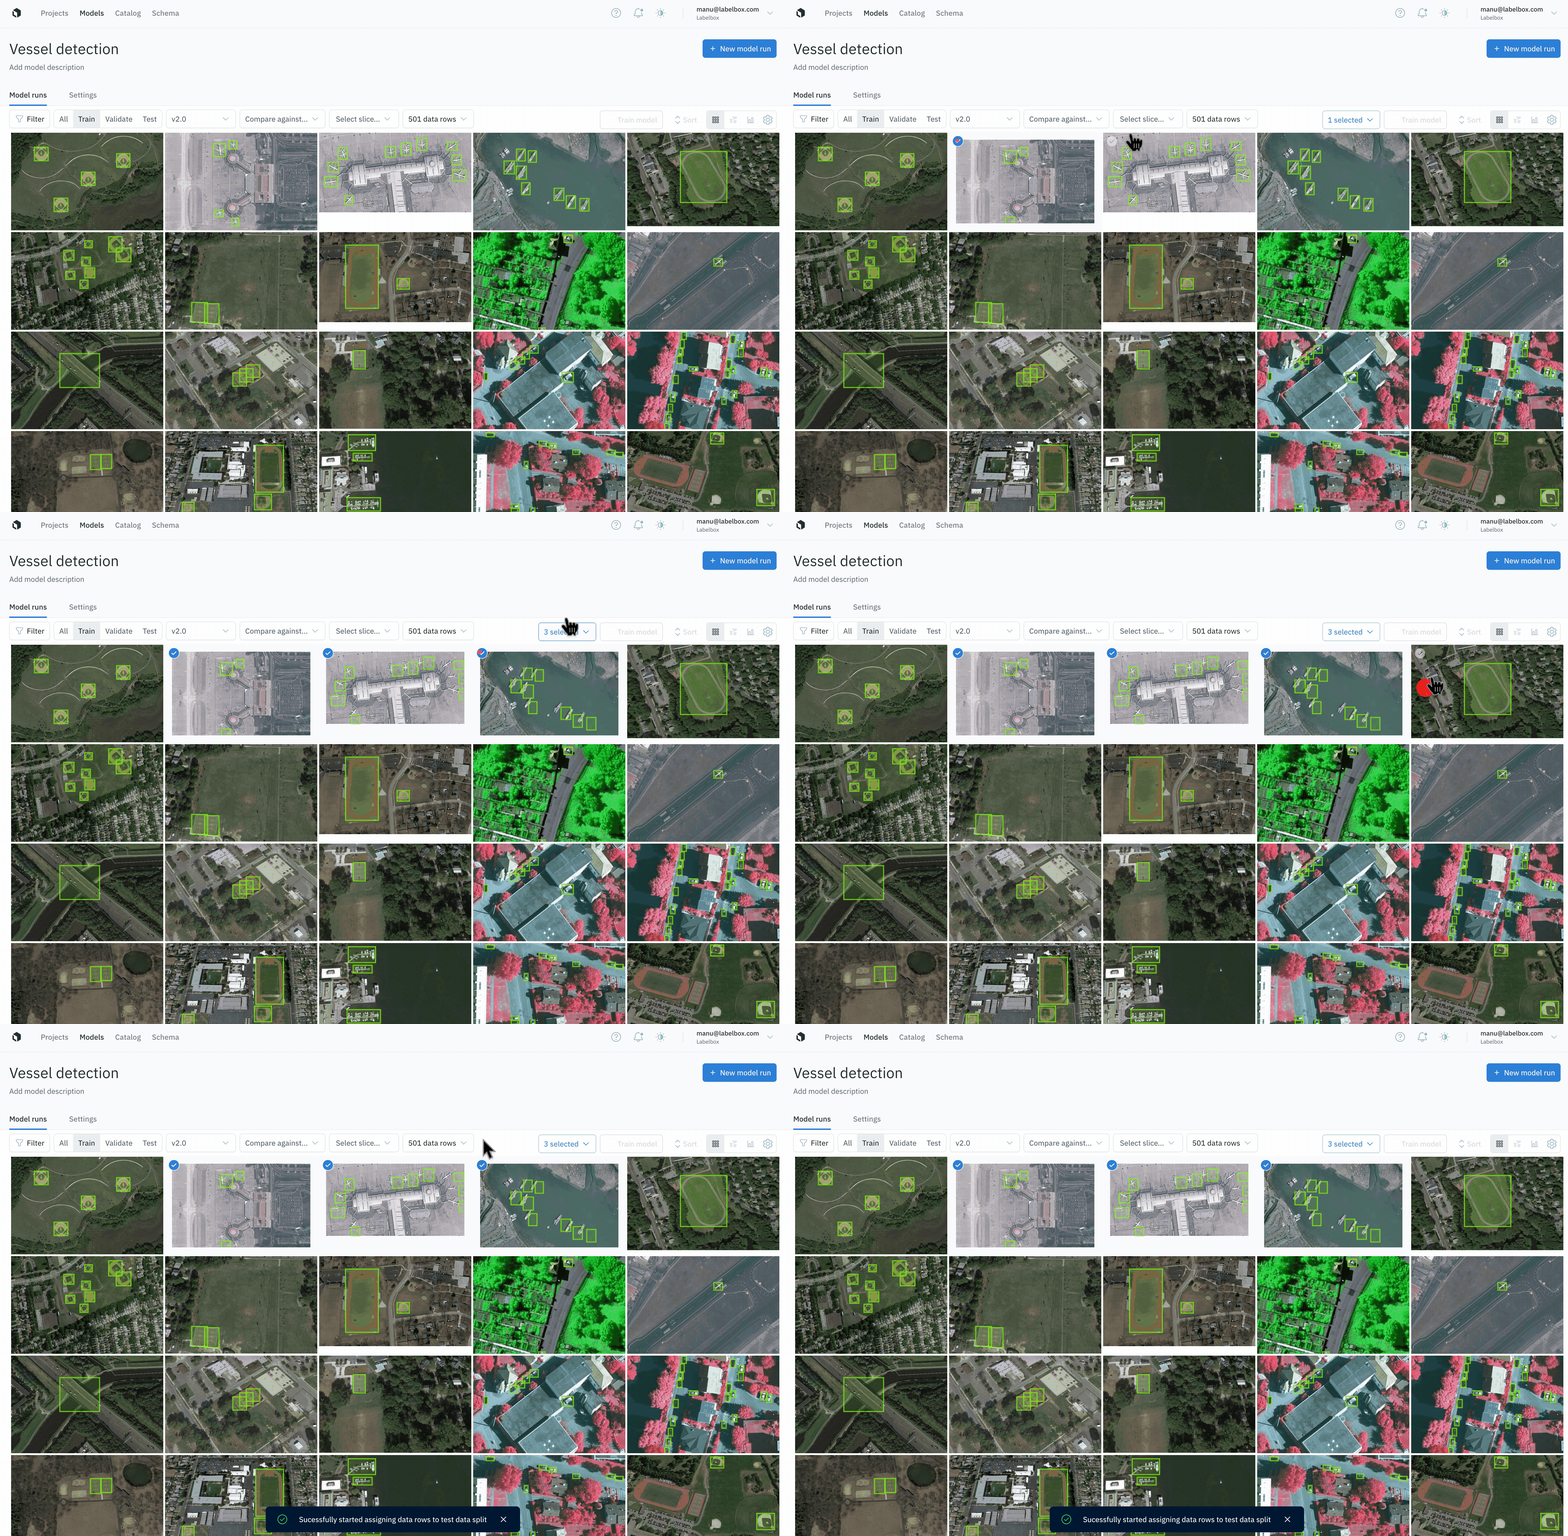
Modify data splits
