Overview
Organize, filter, visualize and explore labeled and unlabeled data with Catalog.
Catalog is a data curation tool for organizing, searching, visualizing, and exploring labeled and unlabeled data (including any metadata). Teams developing and operating production AI systems need a data catalog to enable data selection for downstream data-centric workflows. This includes data labeling, model training, model evaluation, error analysis, and active learning.

How Catalog works
Data can flow into and out of the Catalog in numerous ways. This diagram indicates how data can flow through the Catalog.

| Data in | Data out |
|---|---|
| Catalog can ingest and display the following: - Data rows - Custom metadata - Media attributes - Ground truth annotations | Data can flow out of the Catalog in the following ways: - Batches - Export |
Data rows in Catalog can be grouped in the following ways:
- Datasets: A collection of data rows uploaded to Labelbox at one time. You can append data rows to an existing dataset if needed.
- Slices: A collection of data rows grouped by a saved filter.
You can also choose to view all of your data rows across all datasets and slices by clicking All datasets.
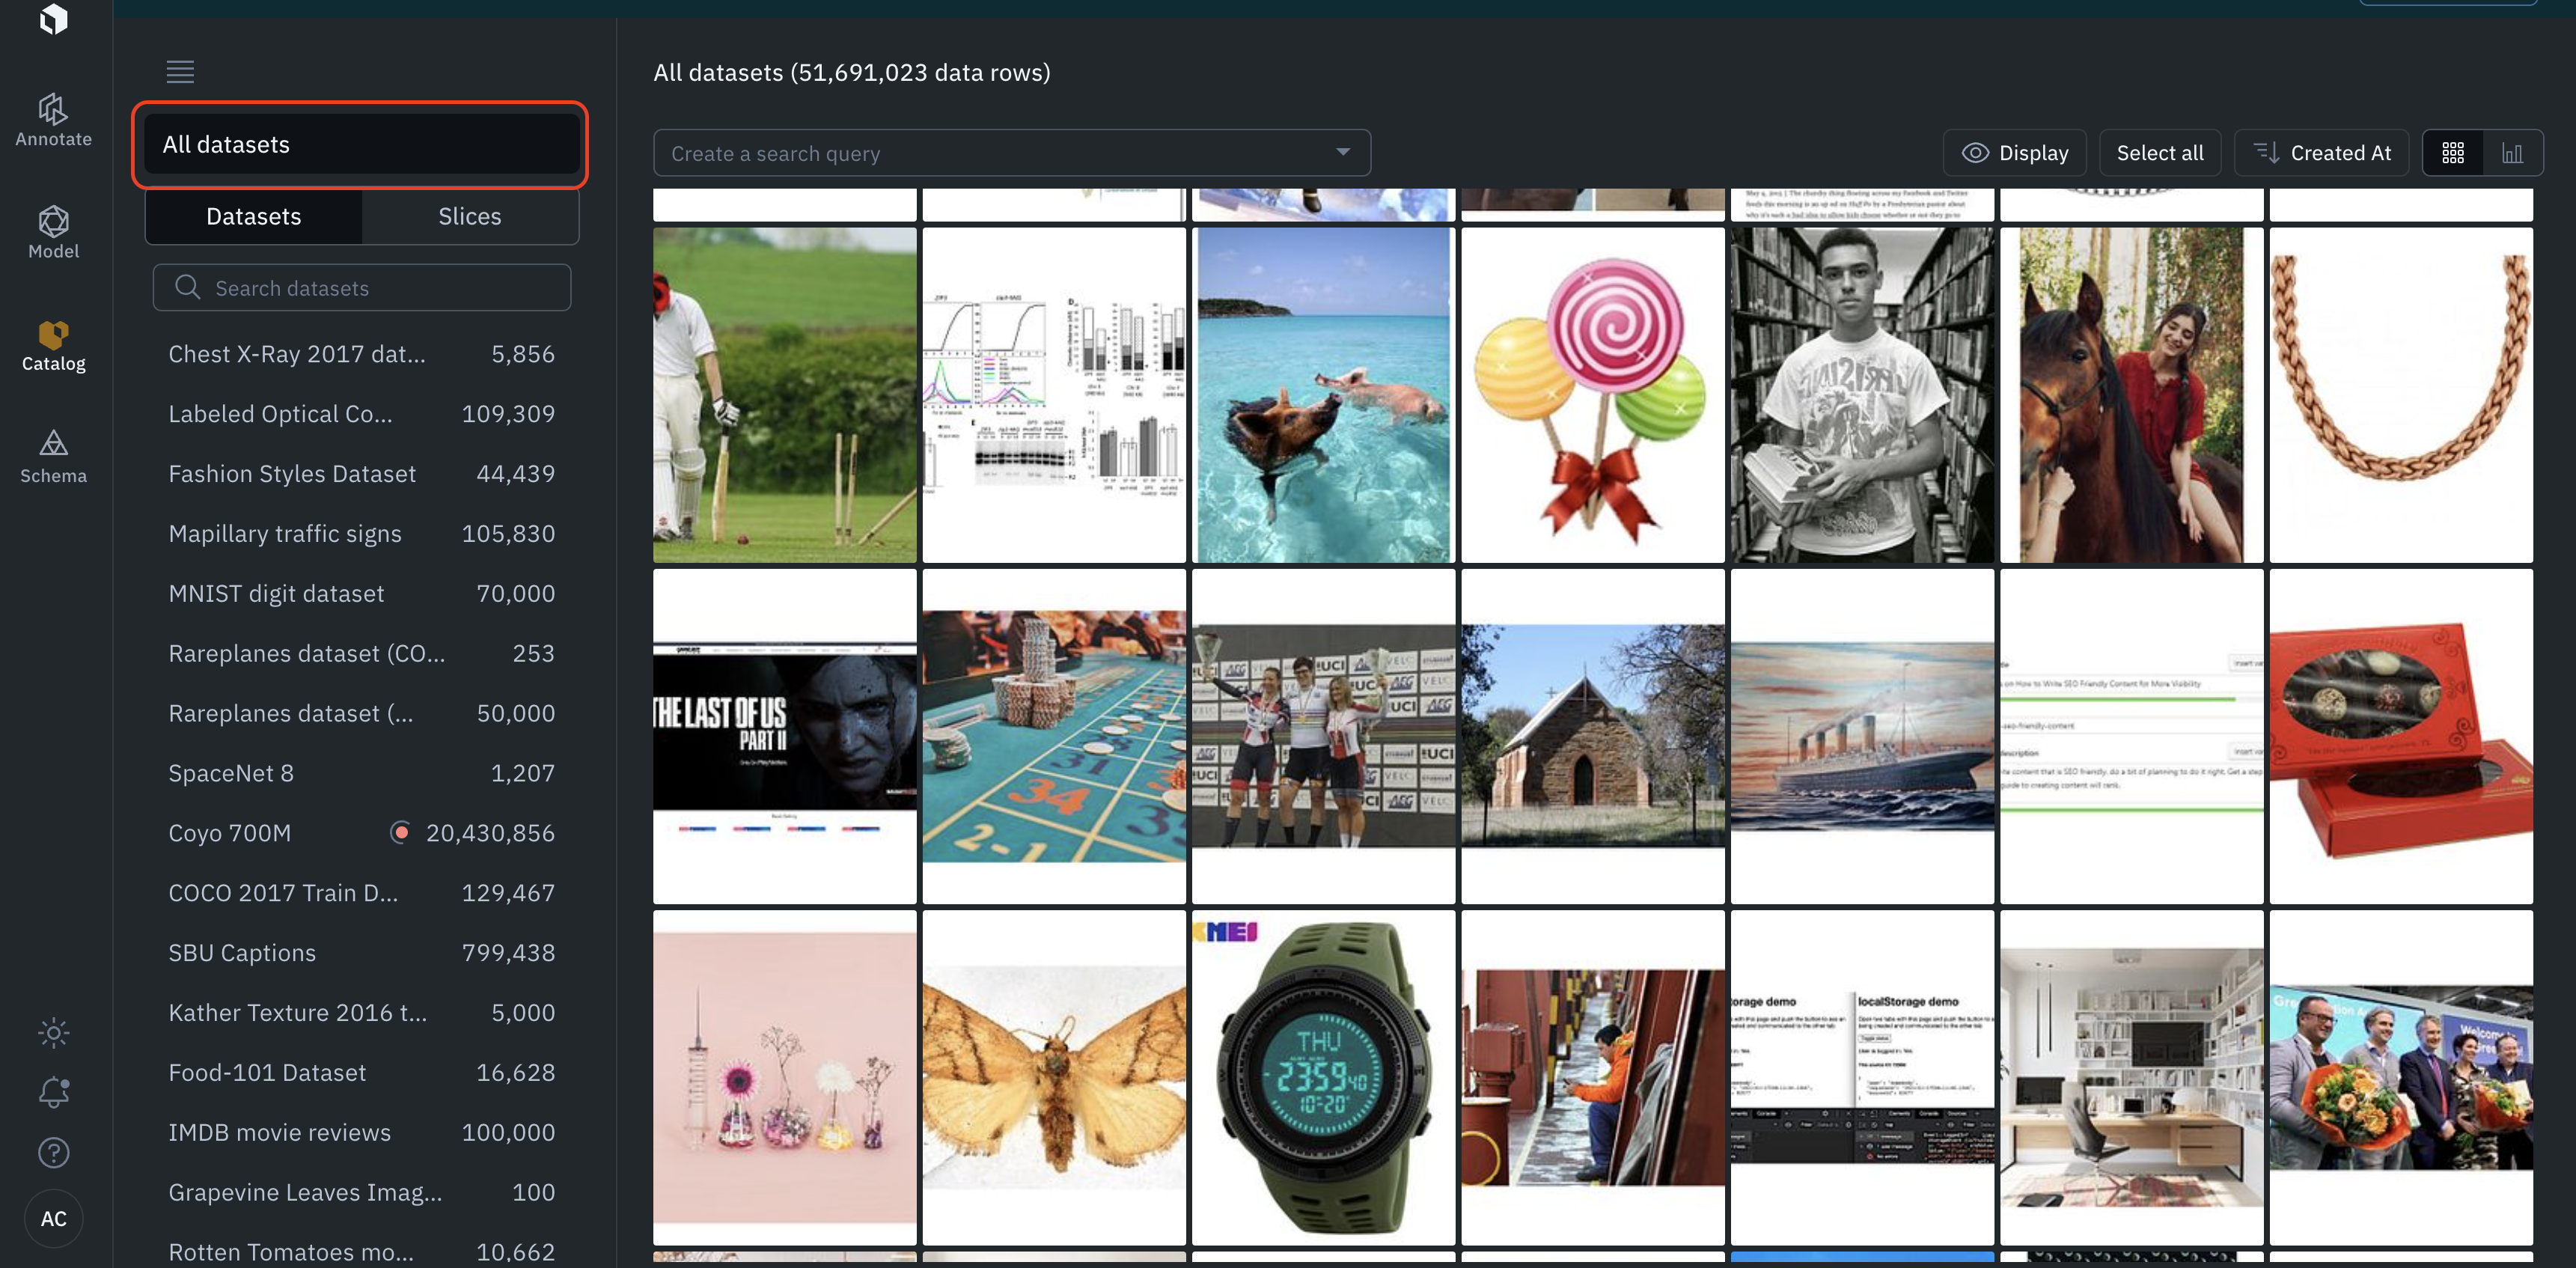
Select this button to show all data rows
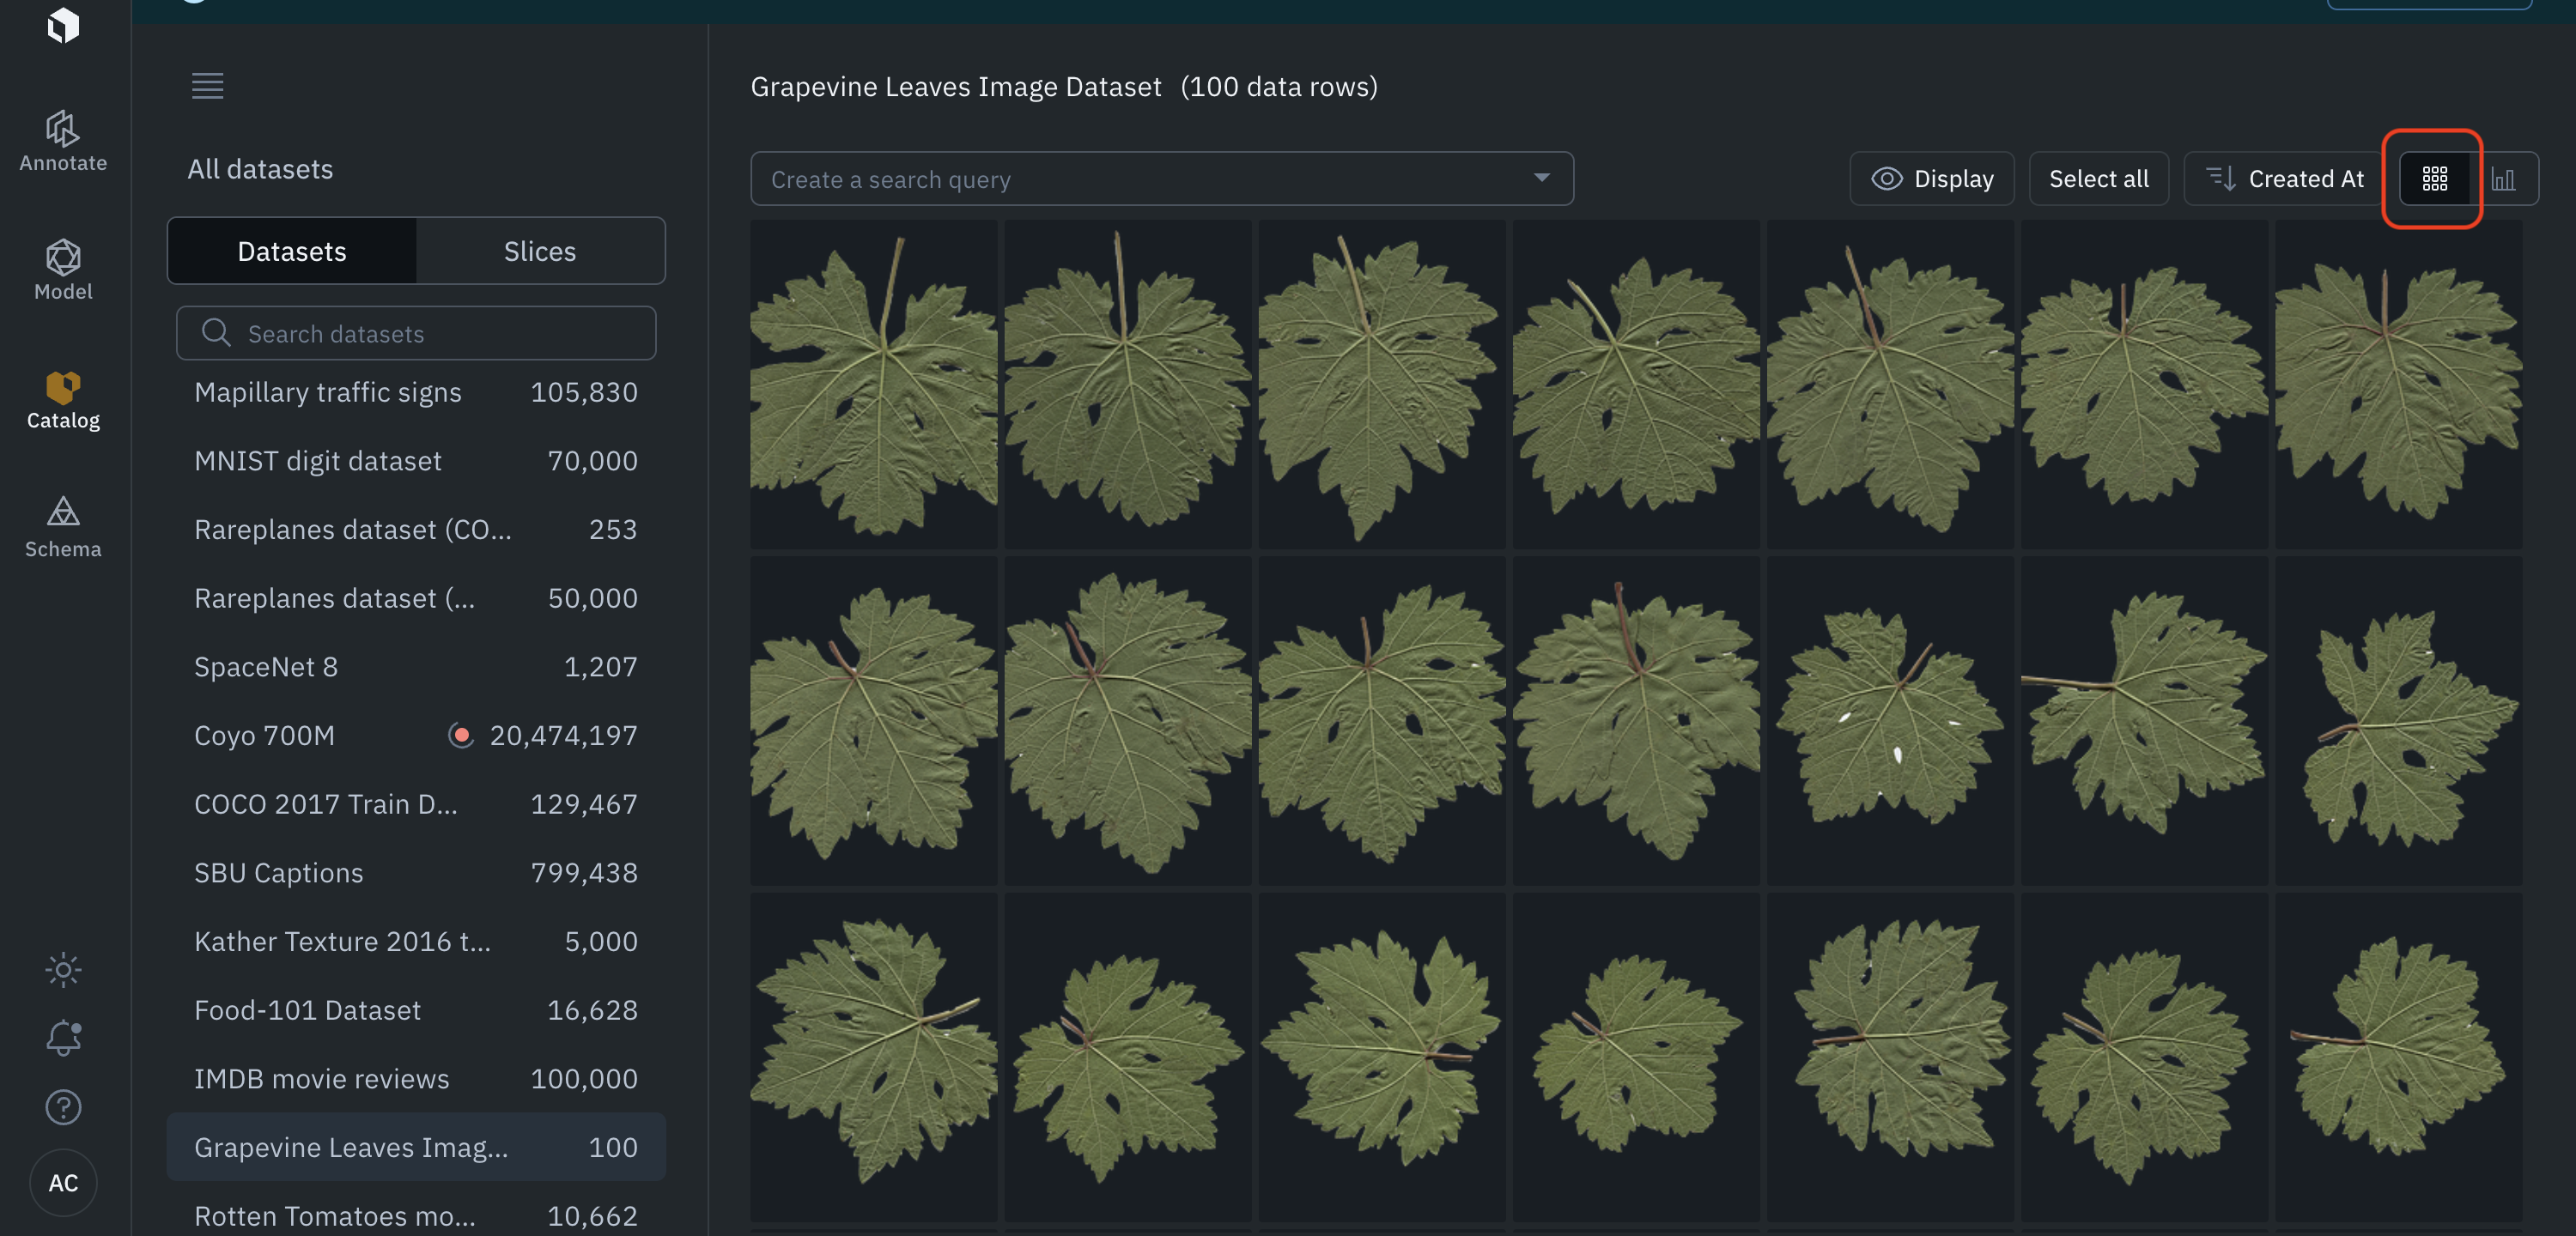
Gallery view
The gallery view is a grid view of the data rows in the Catalog. It is the default view of the Catalog.
If you search data in the Catalog, using filters, only the filtered data rows will show up in the gallery view.
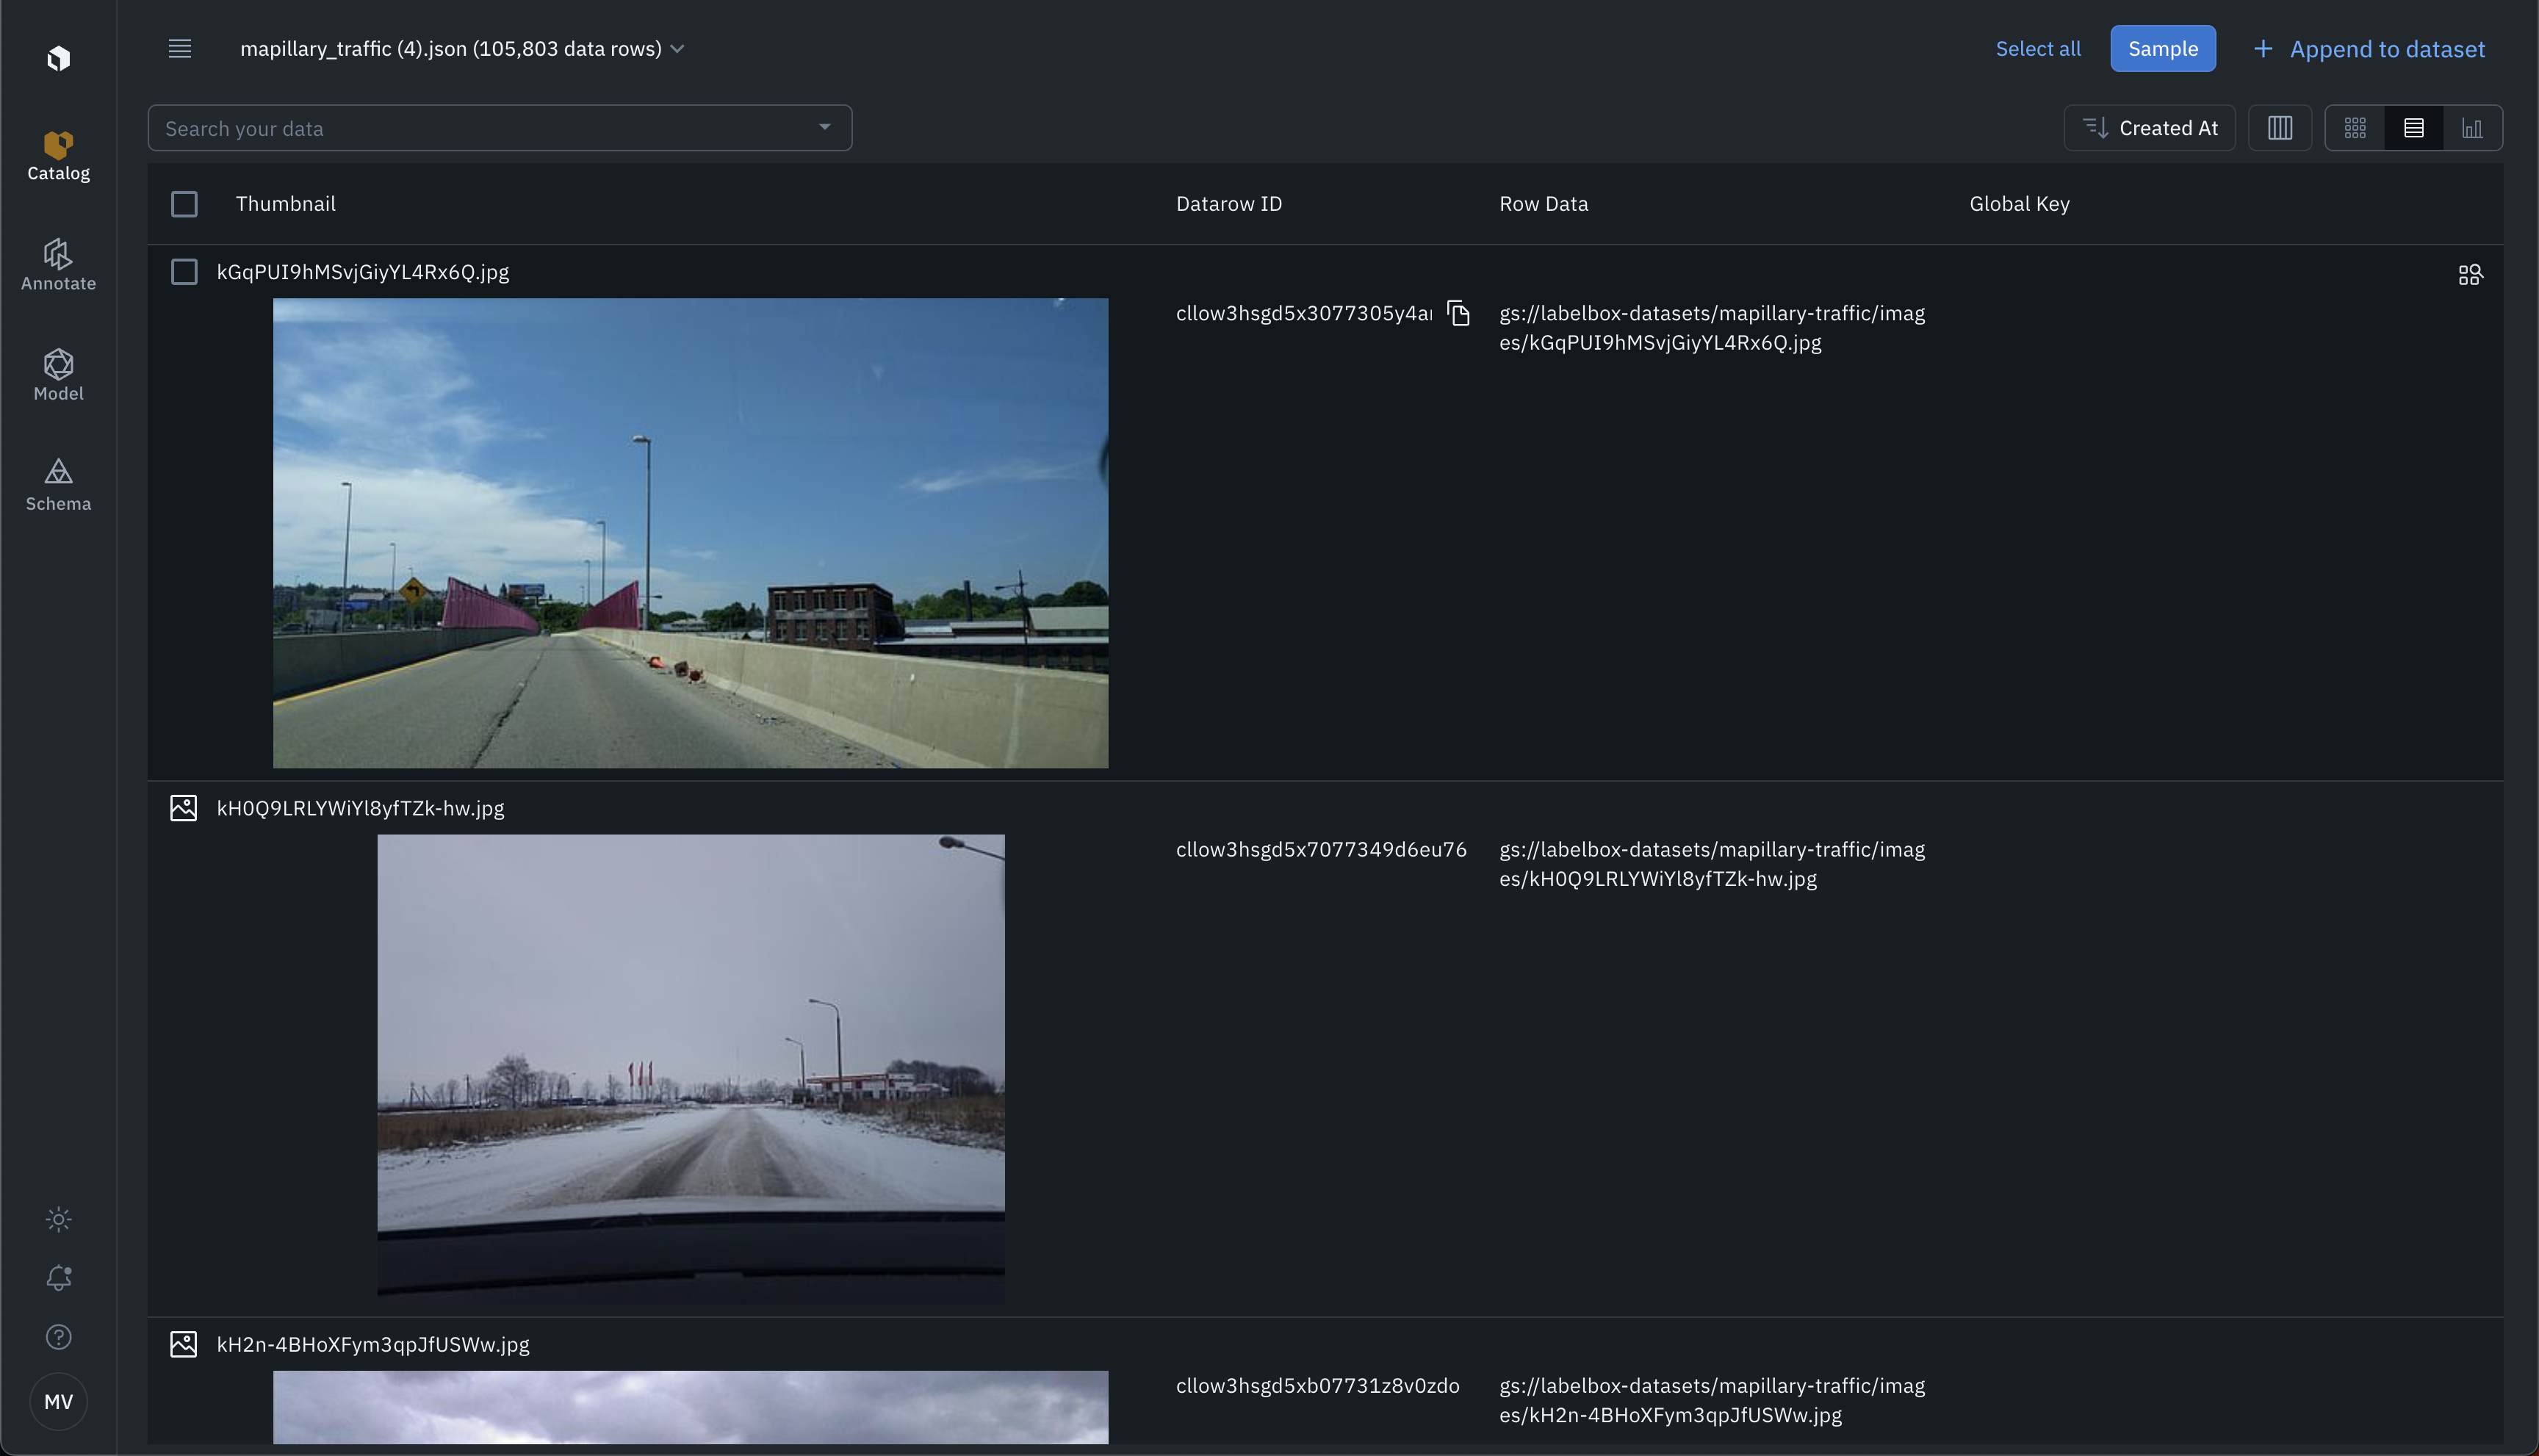
List view
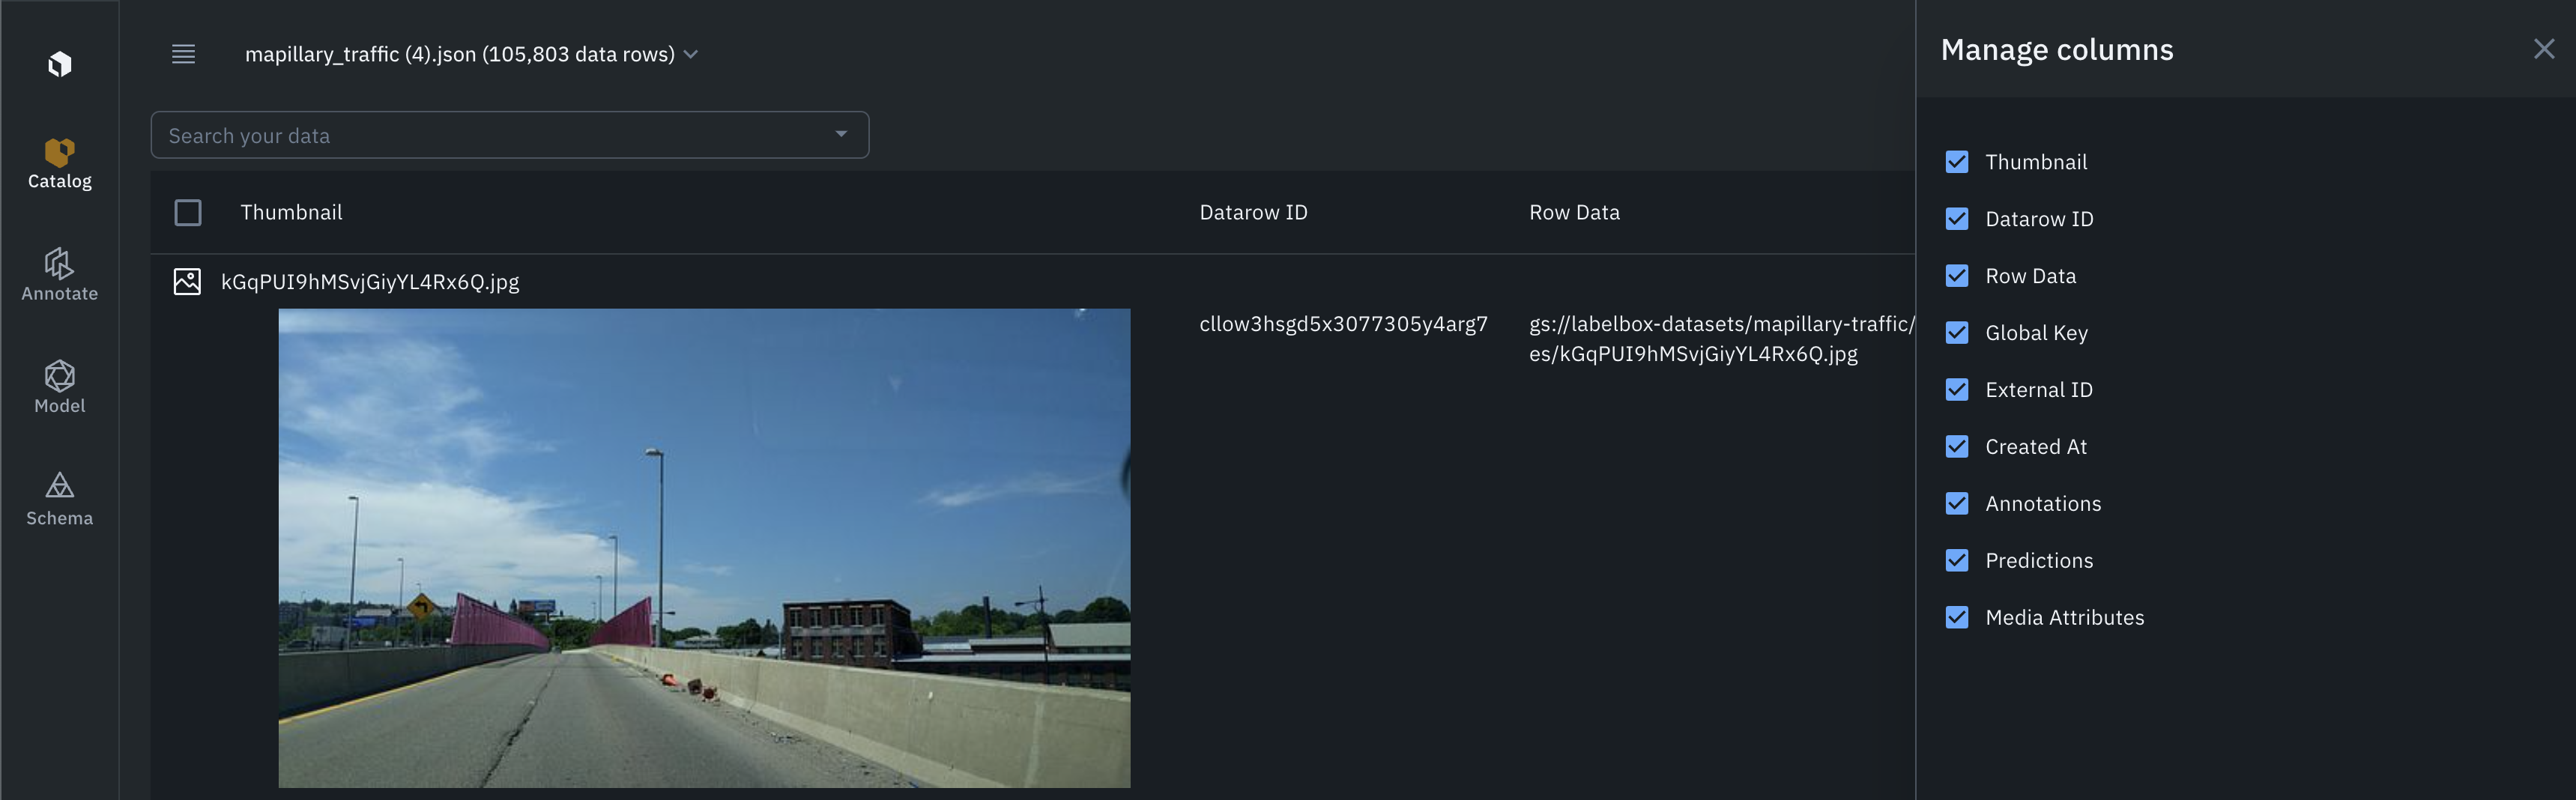
The list view allows users to visualize data rows, alongside data row fields such as data row ID, global key, external ID, row data, time of creation, annotations, predictions, and media attributes.
If you search data in the Catalog, using filters, only the filtered data rows will show up in the list view.
Customize the list view
Users can customize the list view by pinning any column to the left or the right.
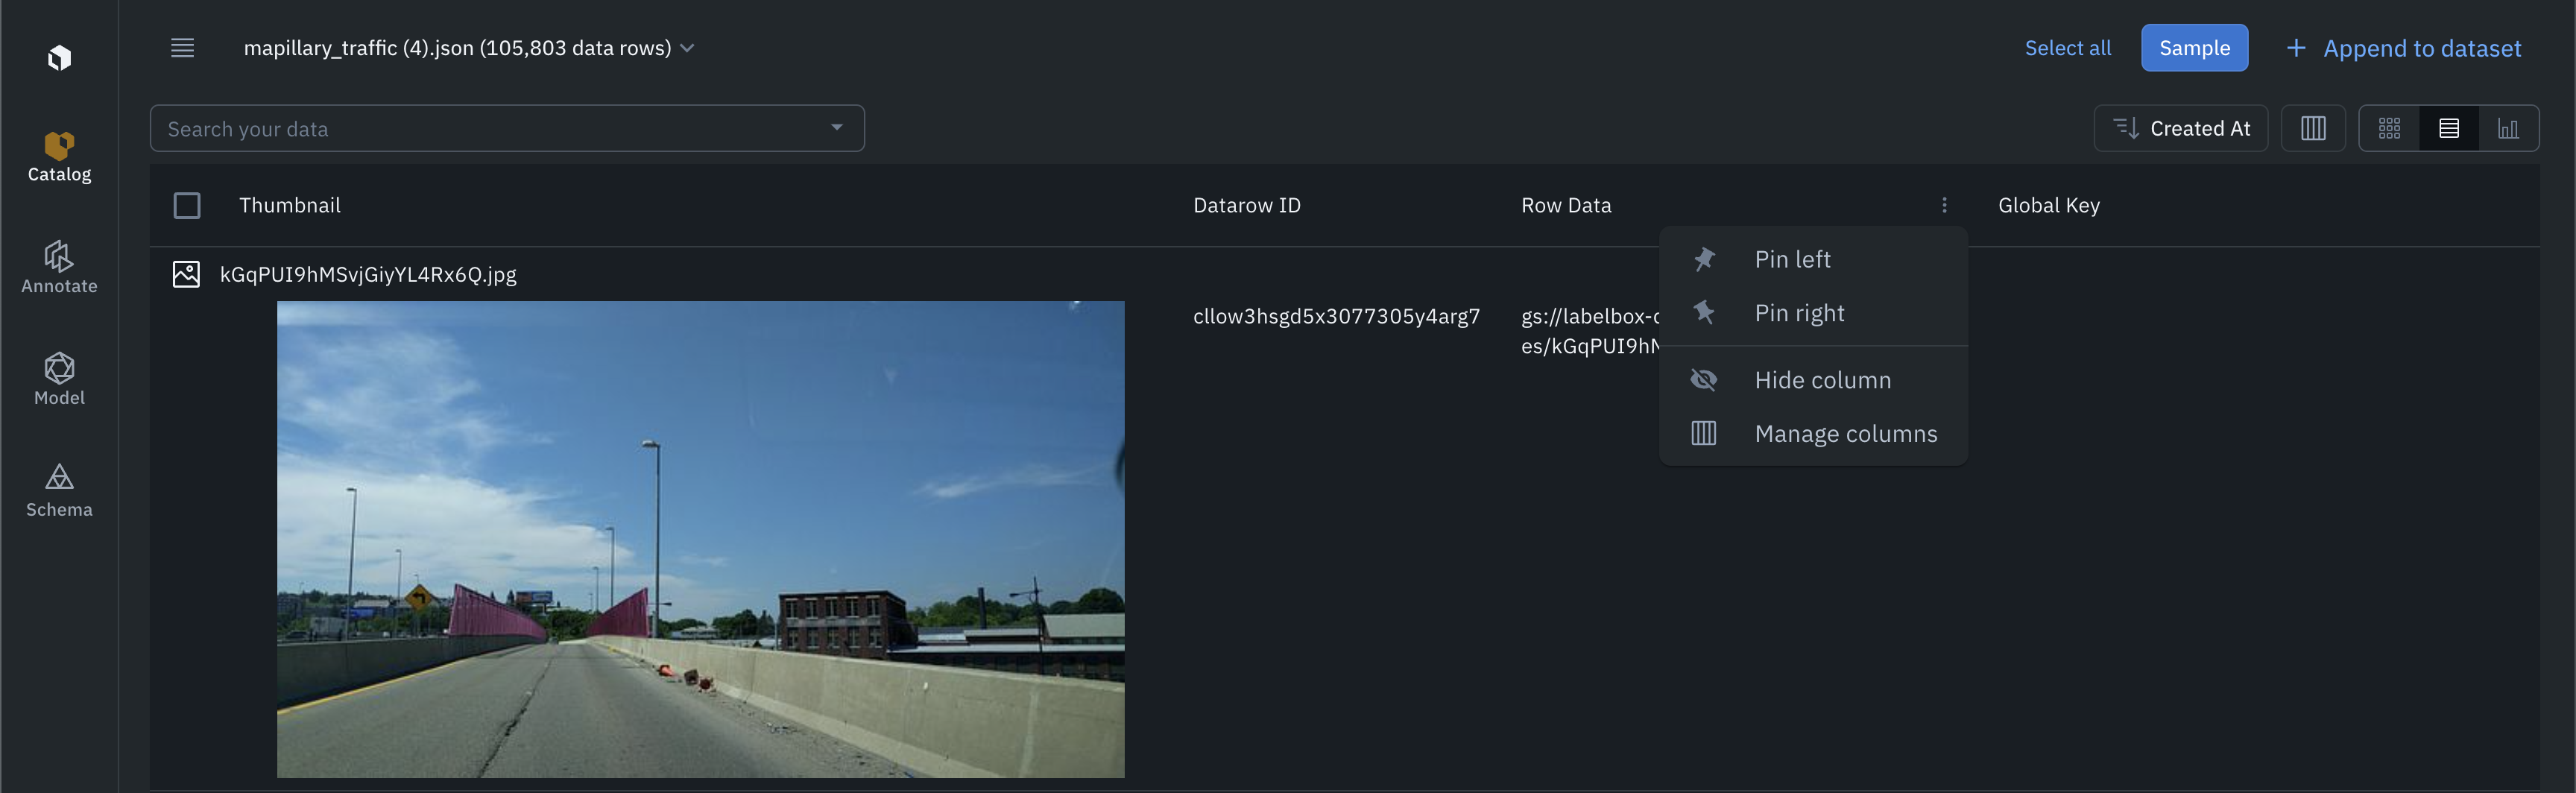
Besides, users can select which columns are visible and hidden, by clicking on the Manage columns icon.
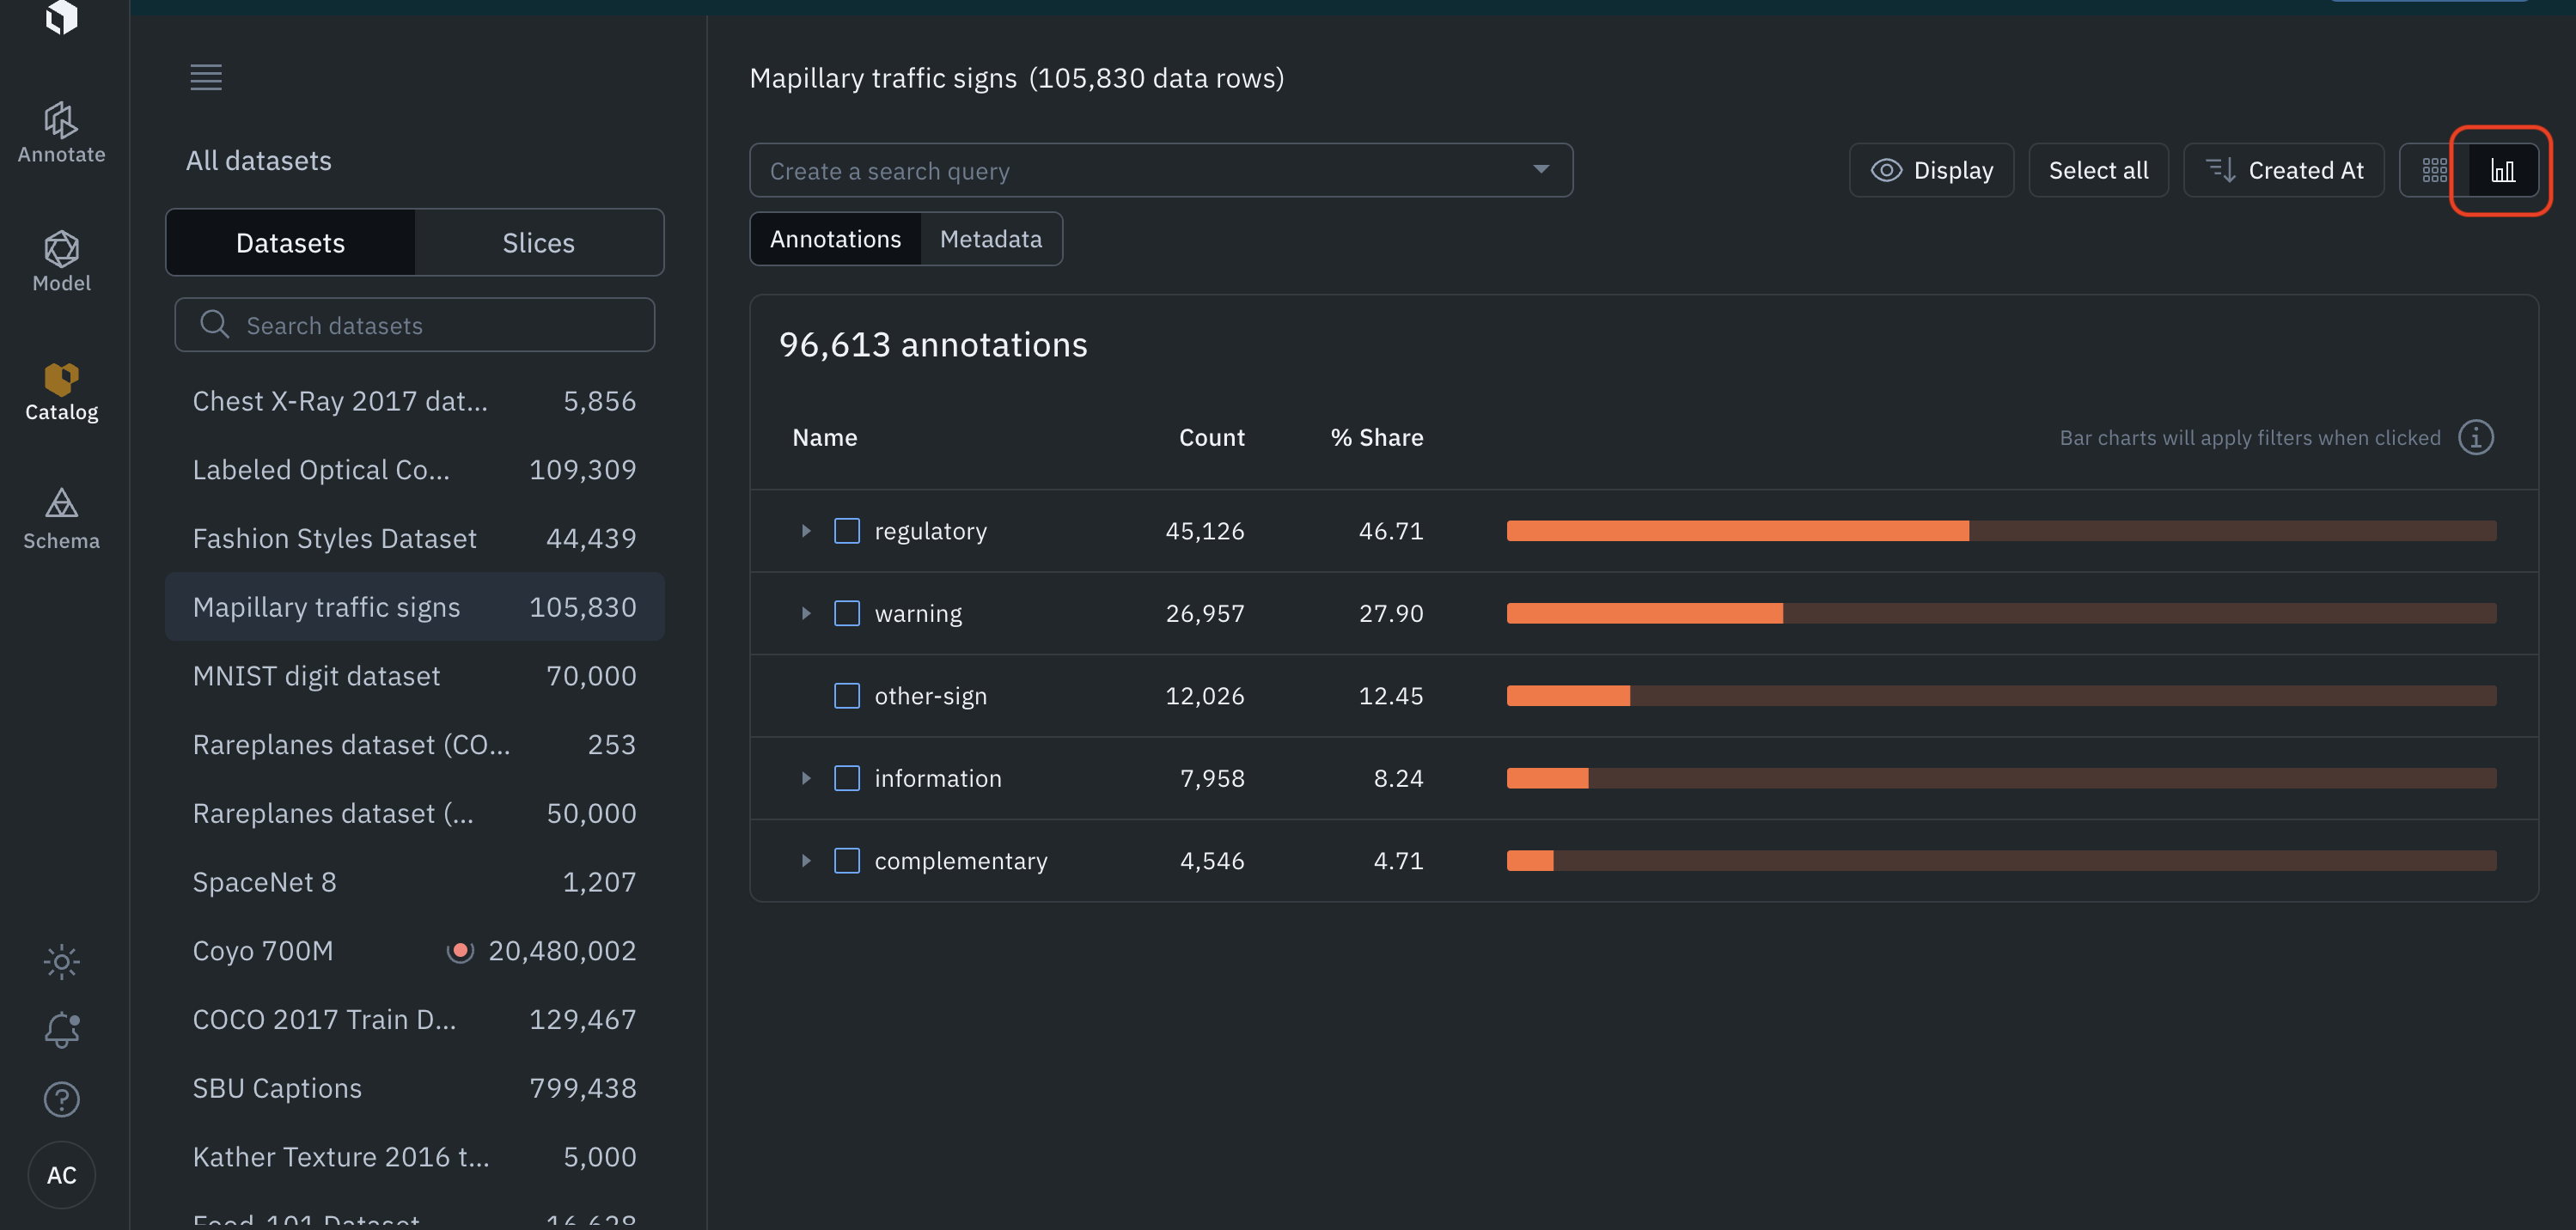
Analytics view
The analytics view helps you understand the distribution of annotations and metadata in the Catalog. You can access the analytics view by clicking on the analytics view icon in the top right.
The analytics view works exactly like the gallery view. If you search data in the Catalog, using filters, only the filtered data rows will show up in the analytics View. This is useful to understand the distribution of annotations and metadata of a specific subset of data.
Annotations distribution
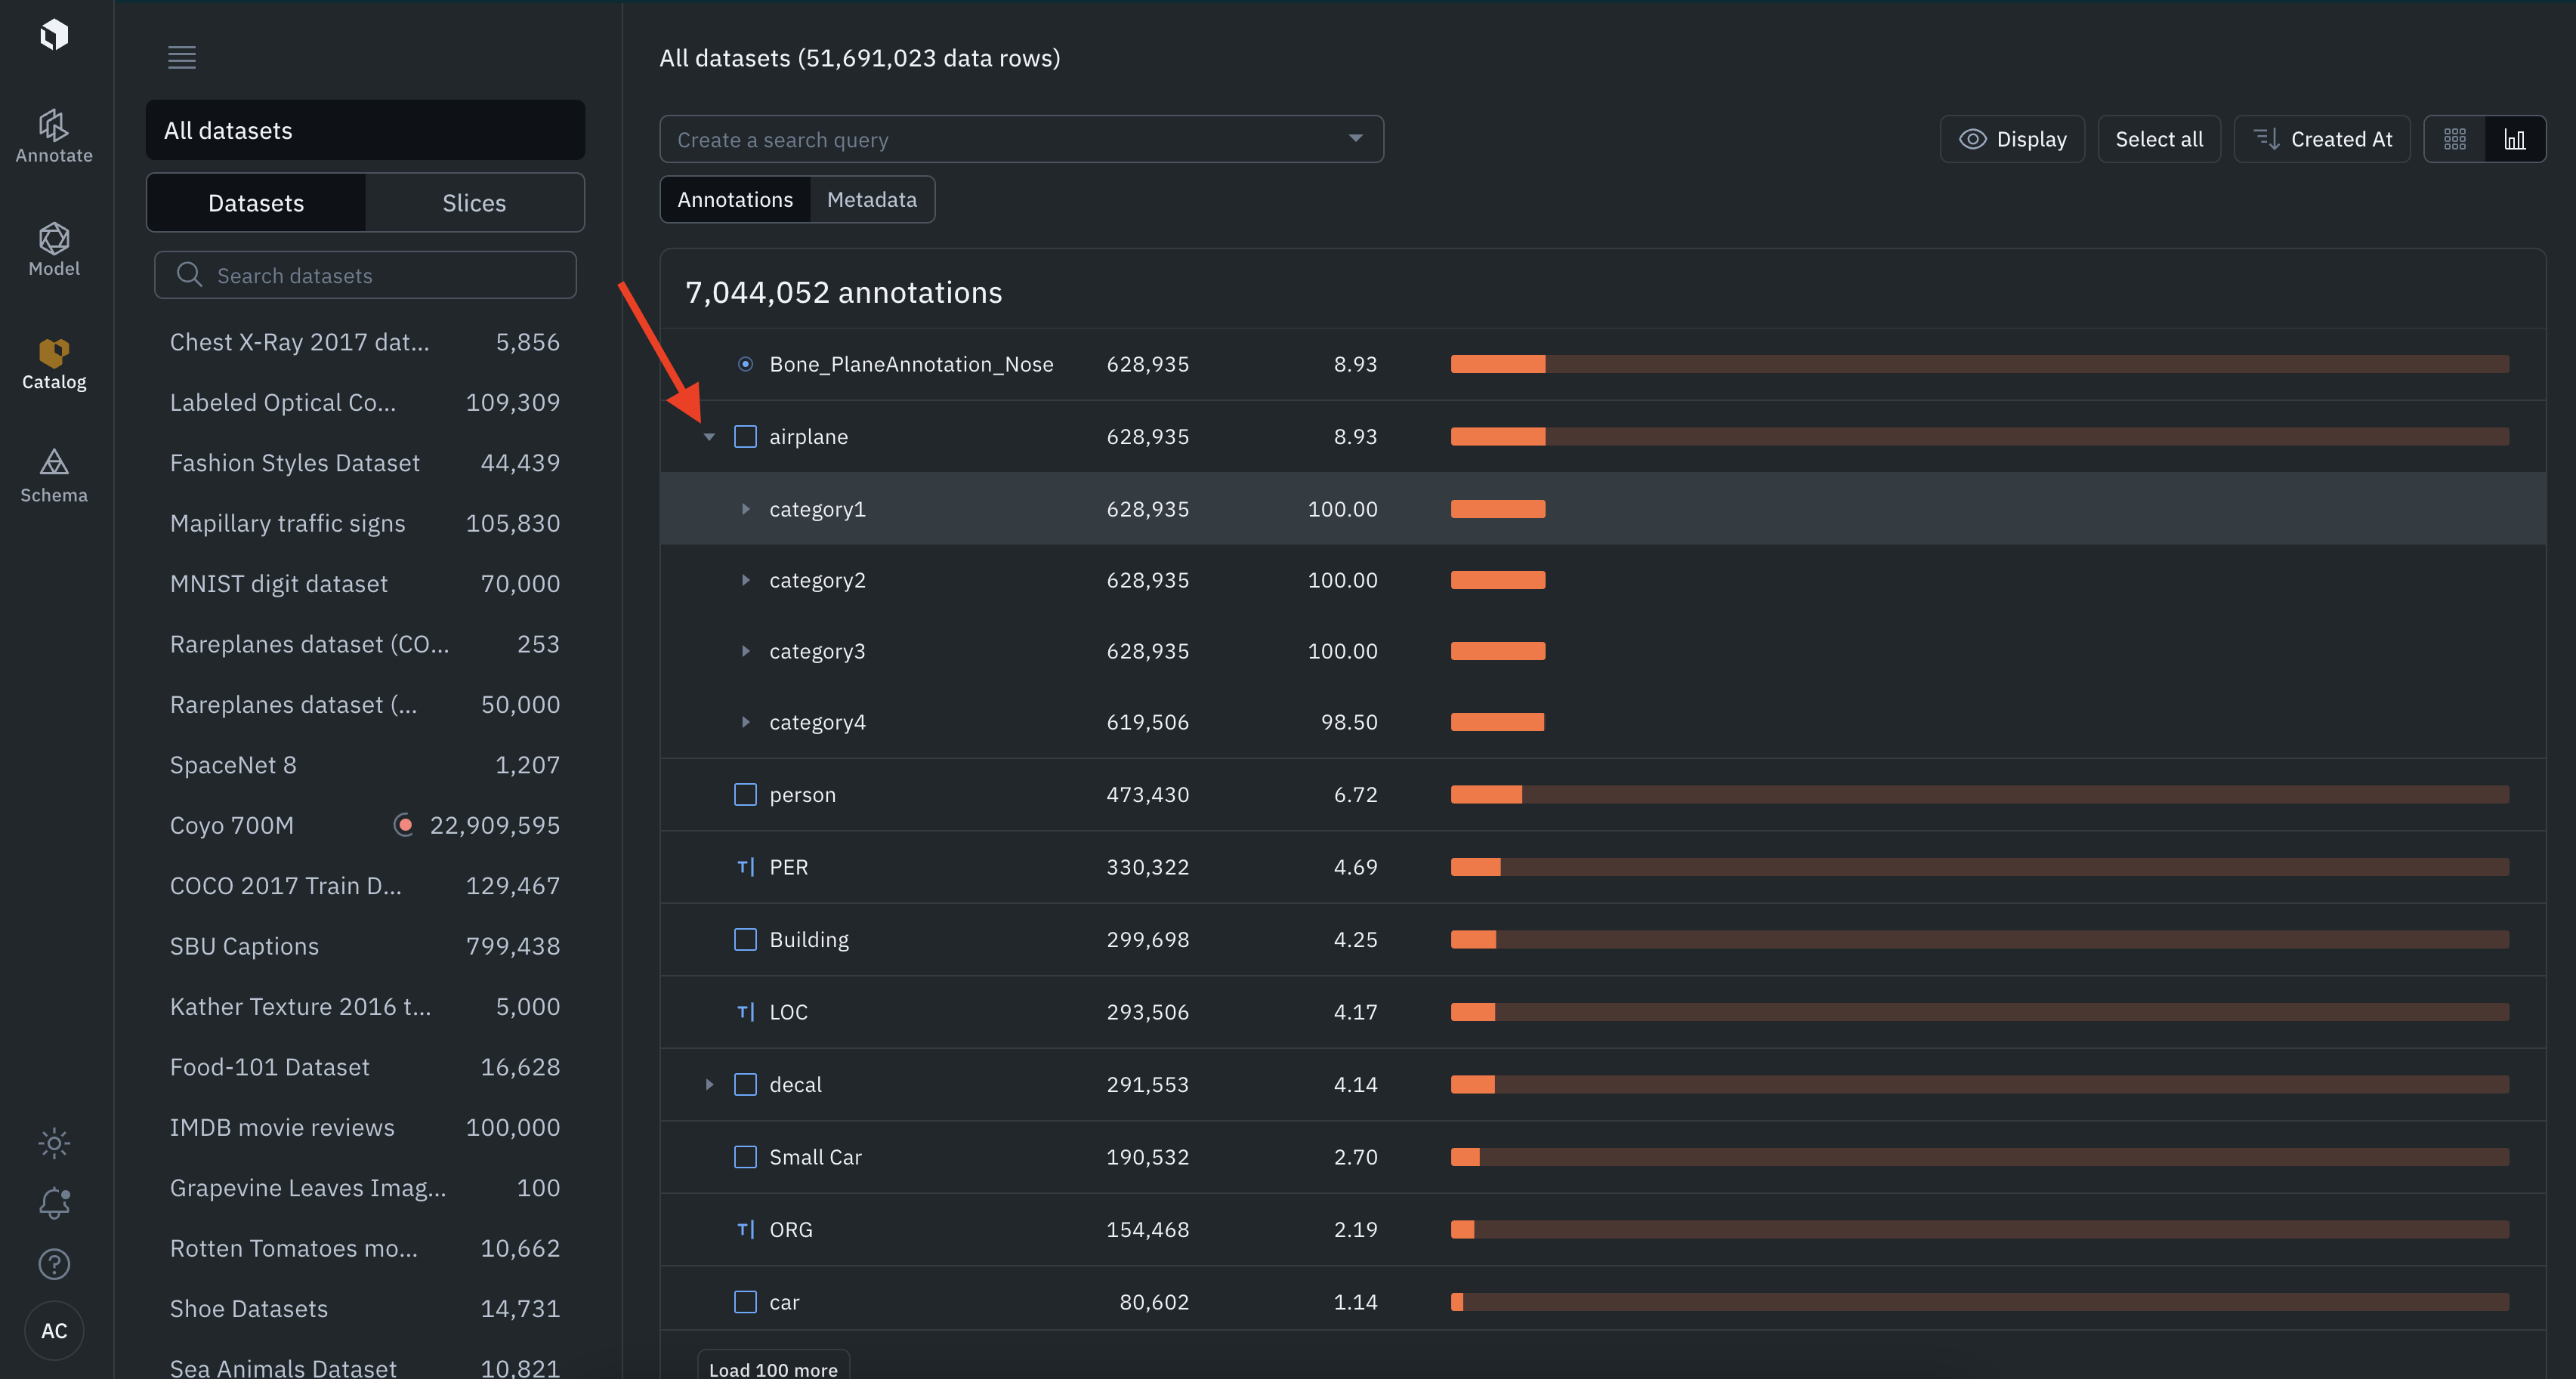
By default, the analytics view shows the distribution of annotations among the filtered data.
Every line in the histogram represents a feature. If the feature has sub-features, you can see the distribution of sub-features by clicking on the arrow on the left of the histogram bar.
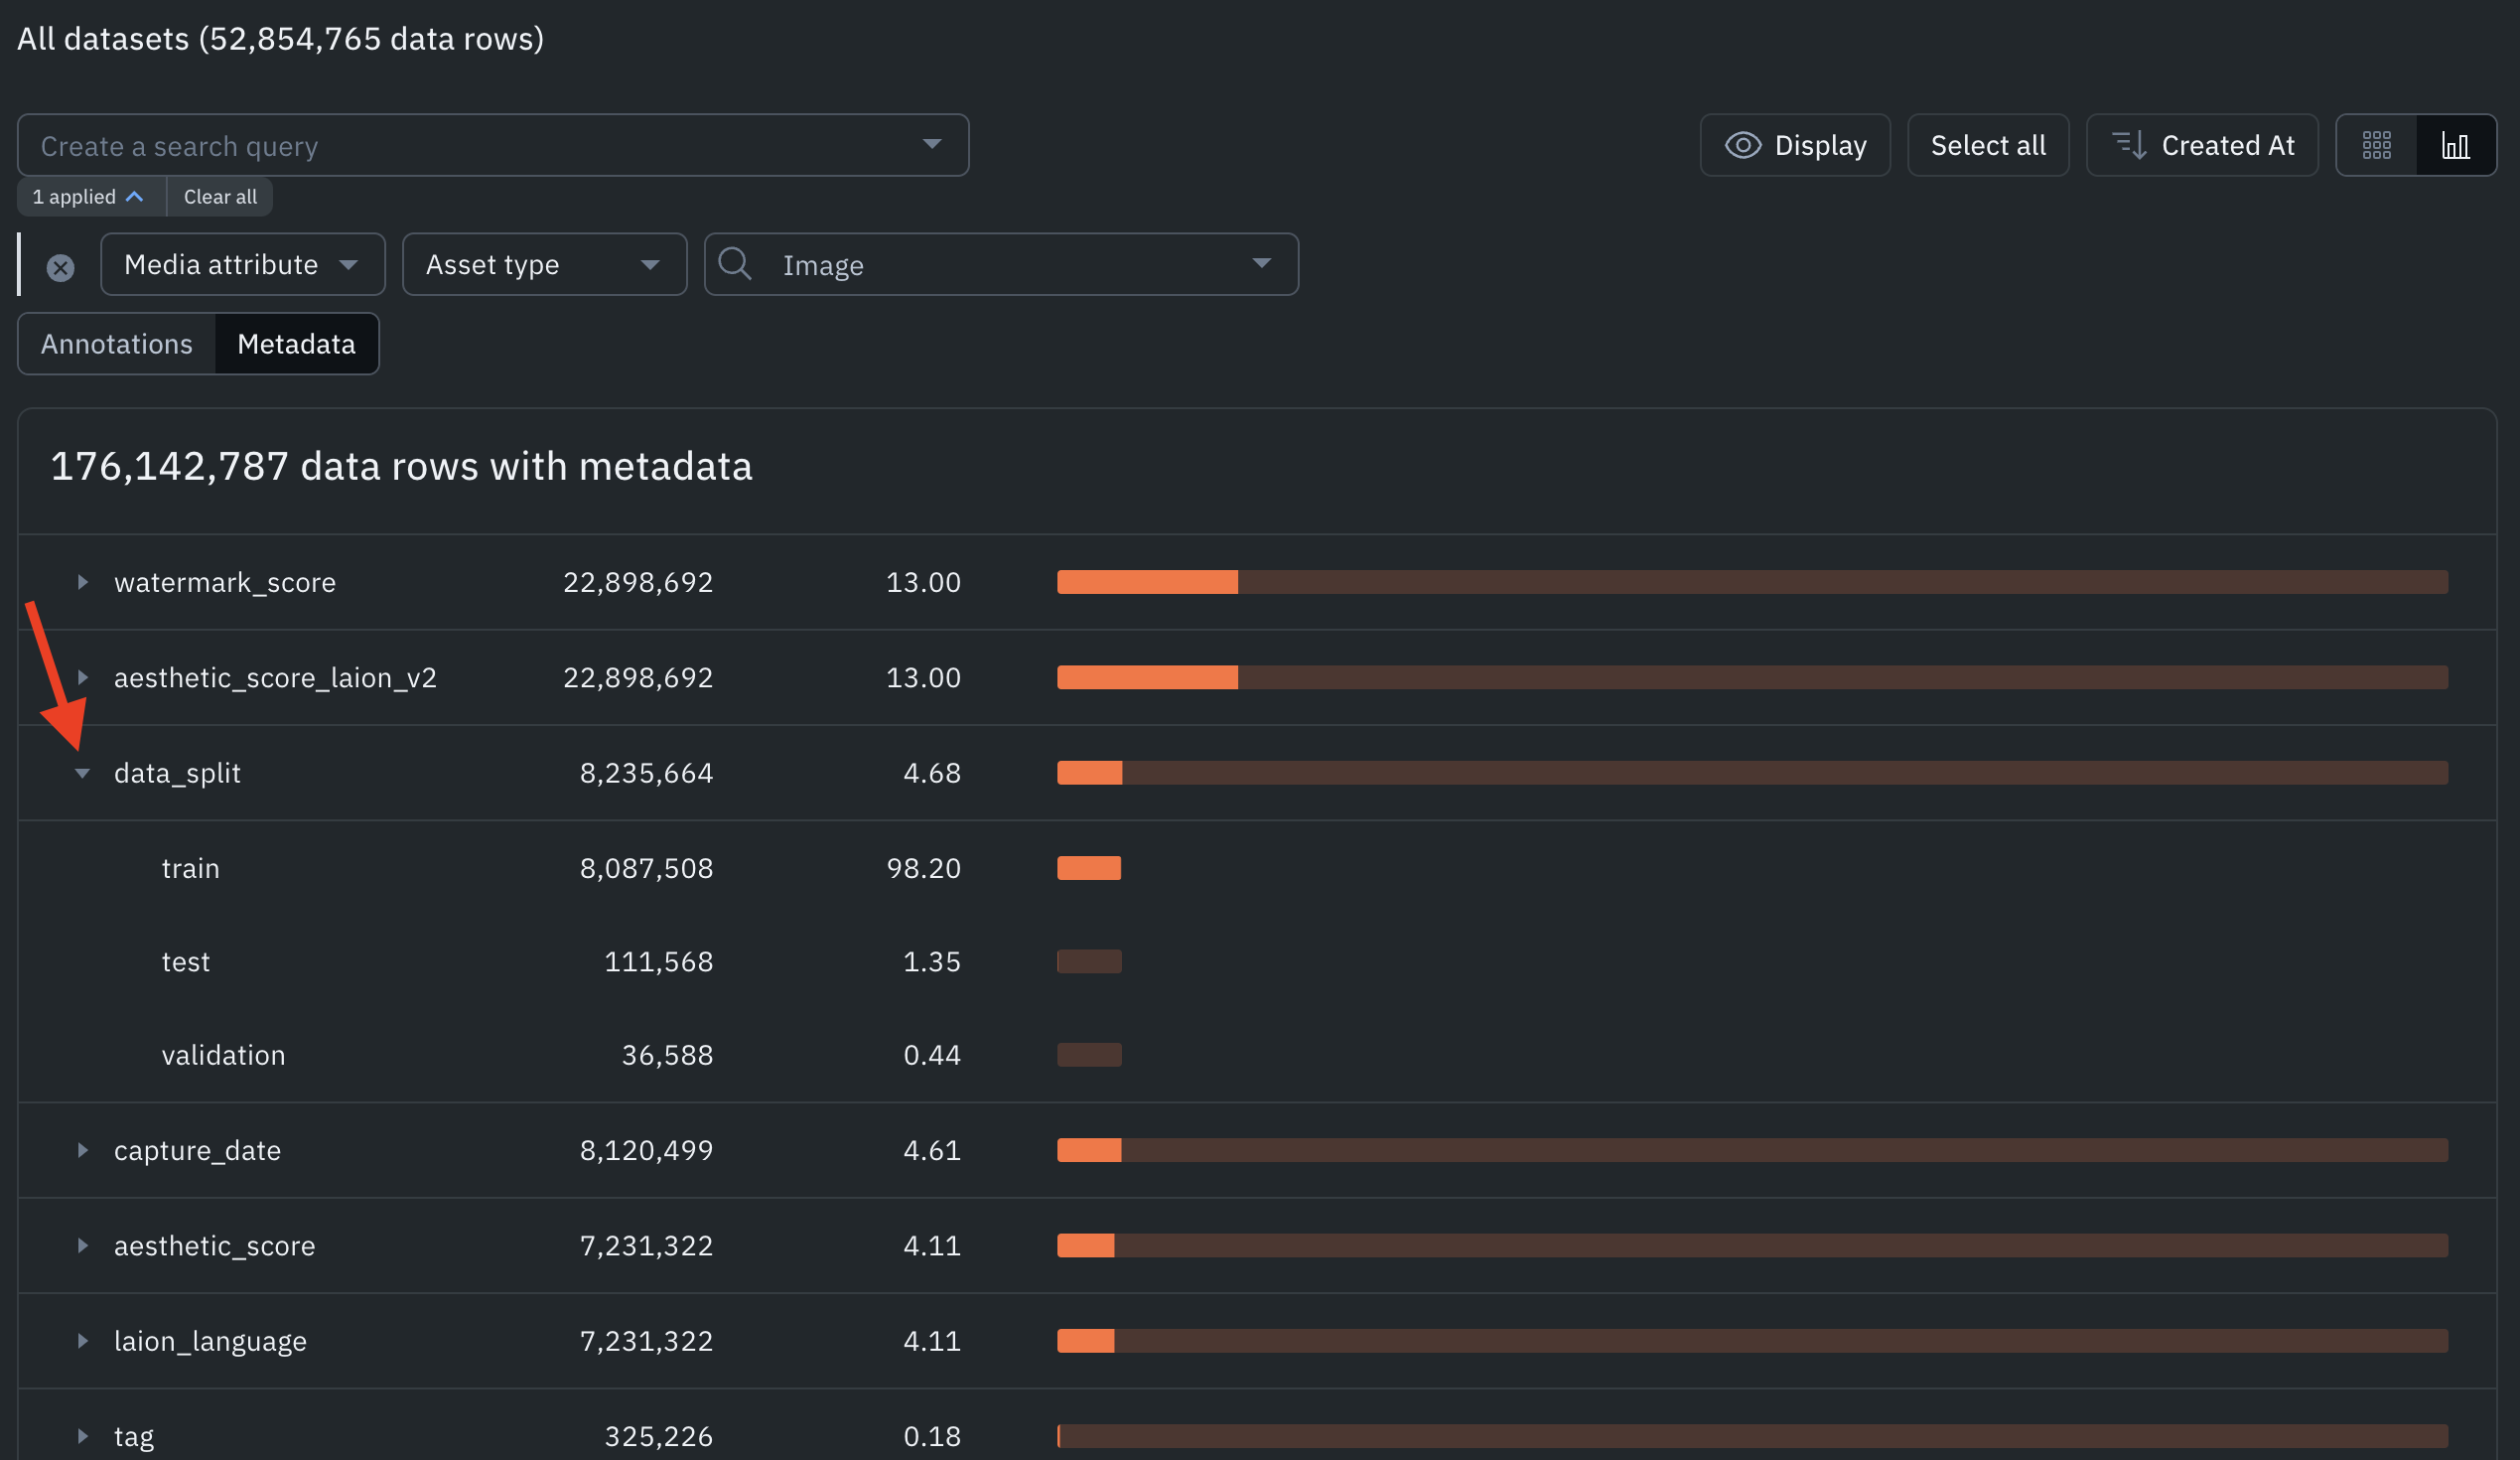
Metadata distribution
The Analytics view allows you to see the distribution of annotations among the filtered data. To do so, click on Metadata.
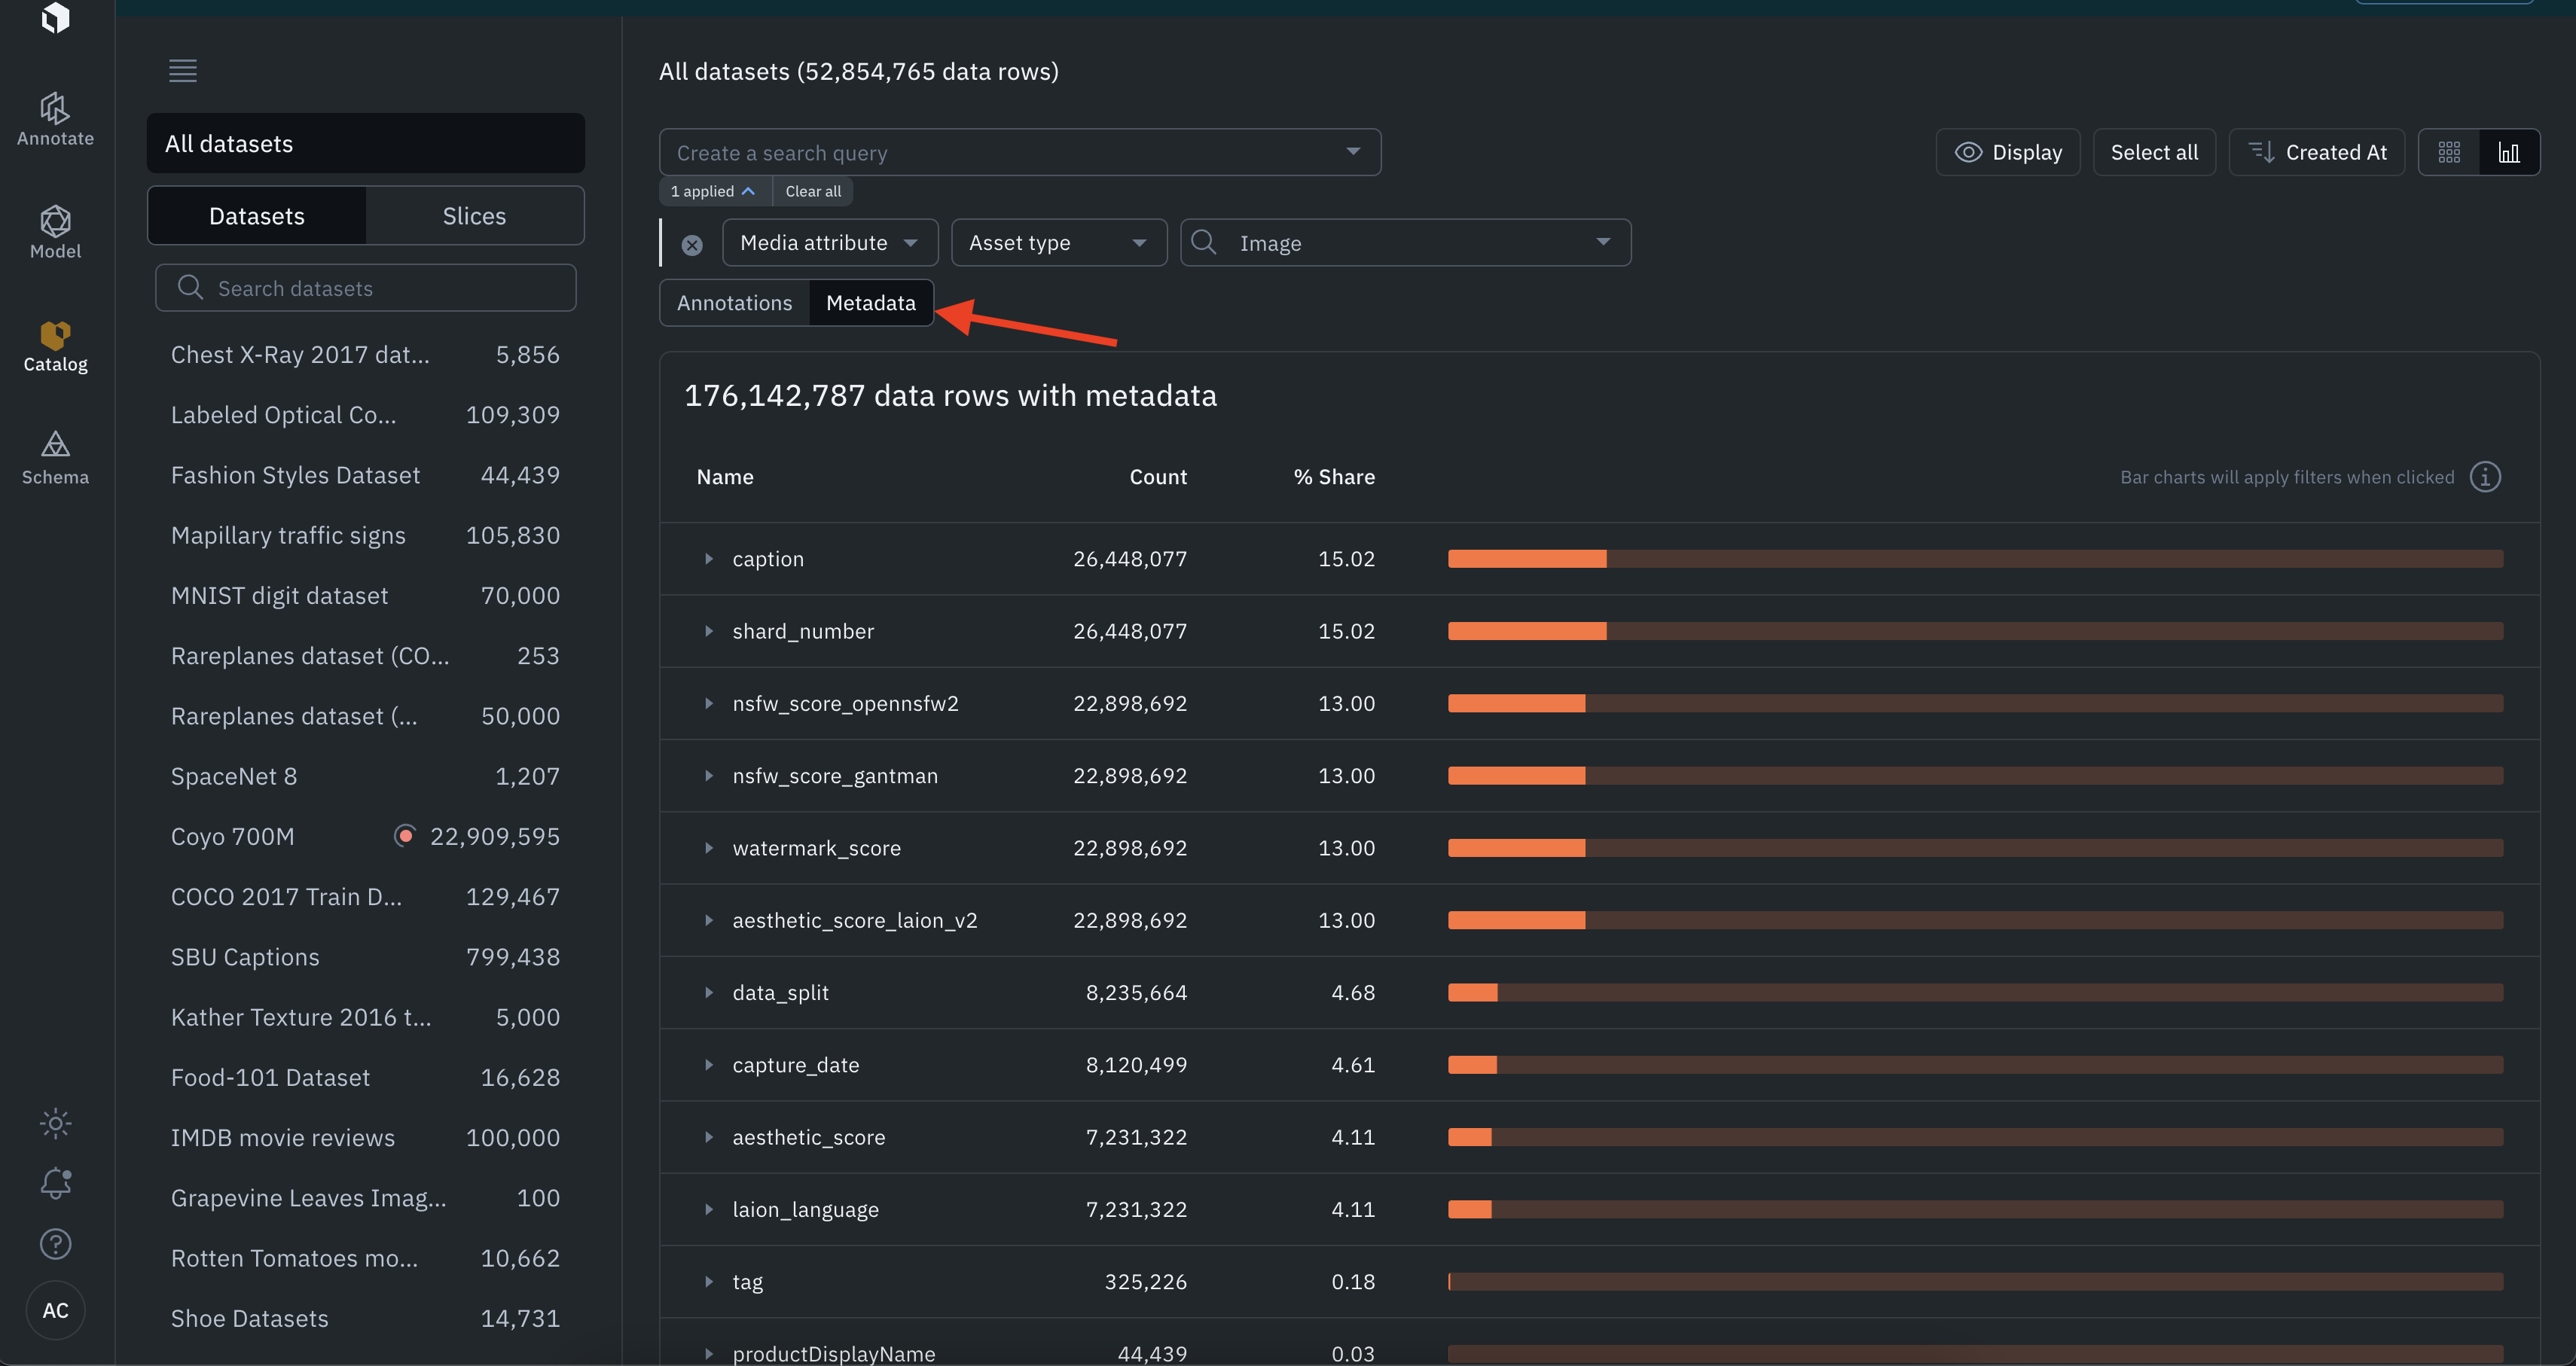
Every line in the histogram represents a metadata field. If the metadata field has sub-fields, you can see the distribution of sub-field by clicking on the arrow on the left of the histogram bar.
Detailed view
By default, you see a grid view of thumbnails. You can access the detailed view, by clicking on any thumbnail. The detailed view enables you to inspect a particular data row.
Display Panel
The display panel allows you to customize the display settings below. You can access it by clicking Display.
- Black color fill data row: replace the data row by black pixels. This is useful to see annotations and predictions stand out
- Greyscale: color the data row in grayscale. This is useful to see annotations and predictions stand out
- Color by feature: all annotations and predictions associated with the same feature, have the same color. Annotations are represented by a solid line. Predictions are represented by a dashed line.
- Color by source: All annotations are represented in a solid green line. All predictions are represented by a dashed red line.

Detailed view display settings
Toggle on/off annotations and predictions
You can toggle on/off annotations and predictions in the detailed view, by clicking on the eye icon next to annotations and predictions.

Visualize attachments
In Catalog, in the detailed view of a data row, you can see its attachments by opening the attachments panel.
See Attachments for instructions on creating attachments and a table of the supported attachment types.

Click on the attachment icon to open the attachment panel

Attachments show up in the attachment panel
Getting started with Catalog
-
Chose data configuration: IAM Integration or Signed URLs
Updated 5 months ago