Performance dashboard
Information on the project performance dashboard and the included metrics.
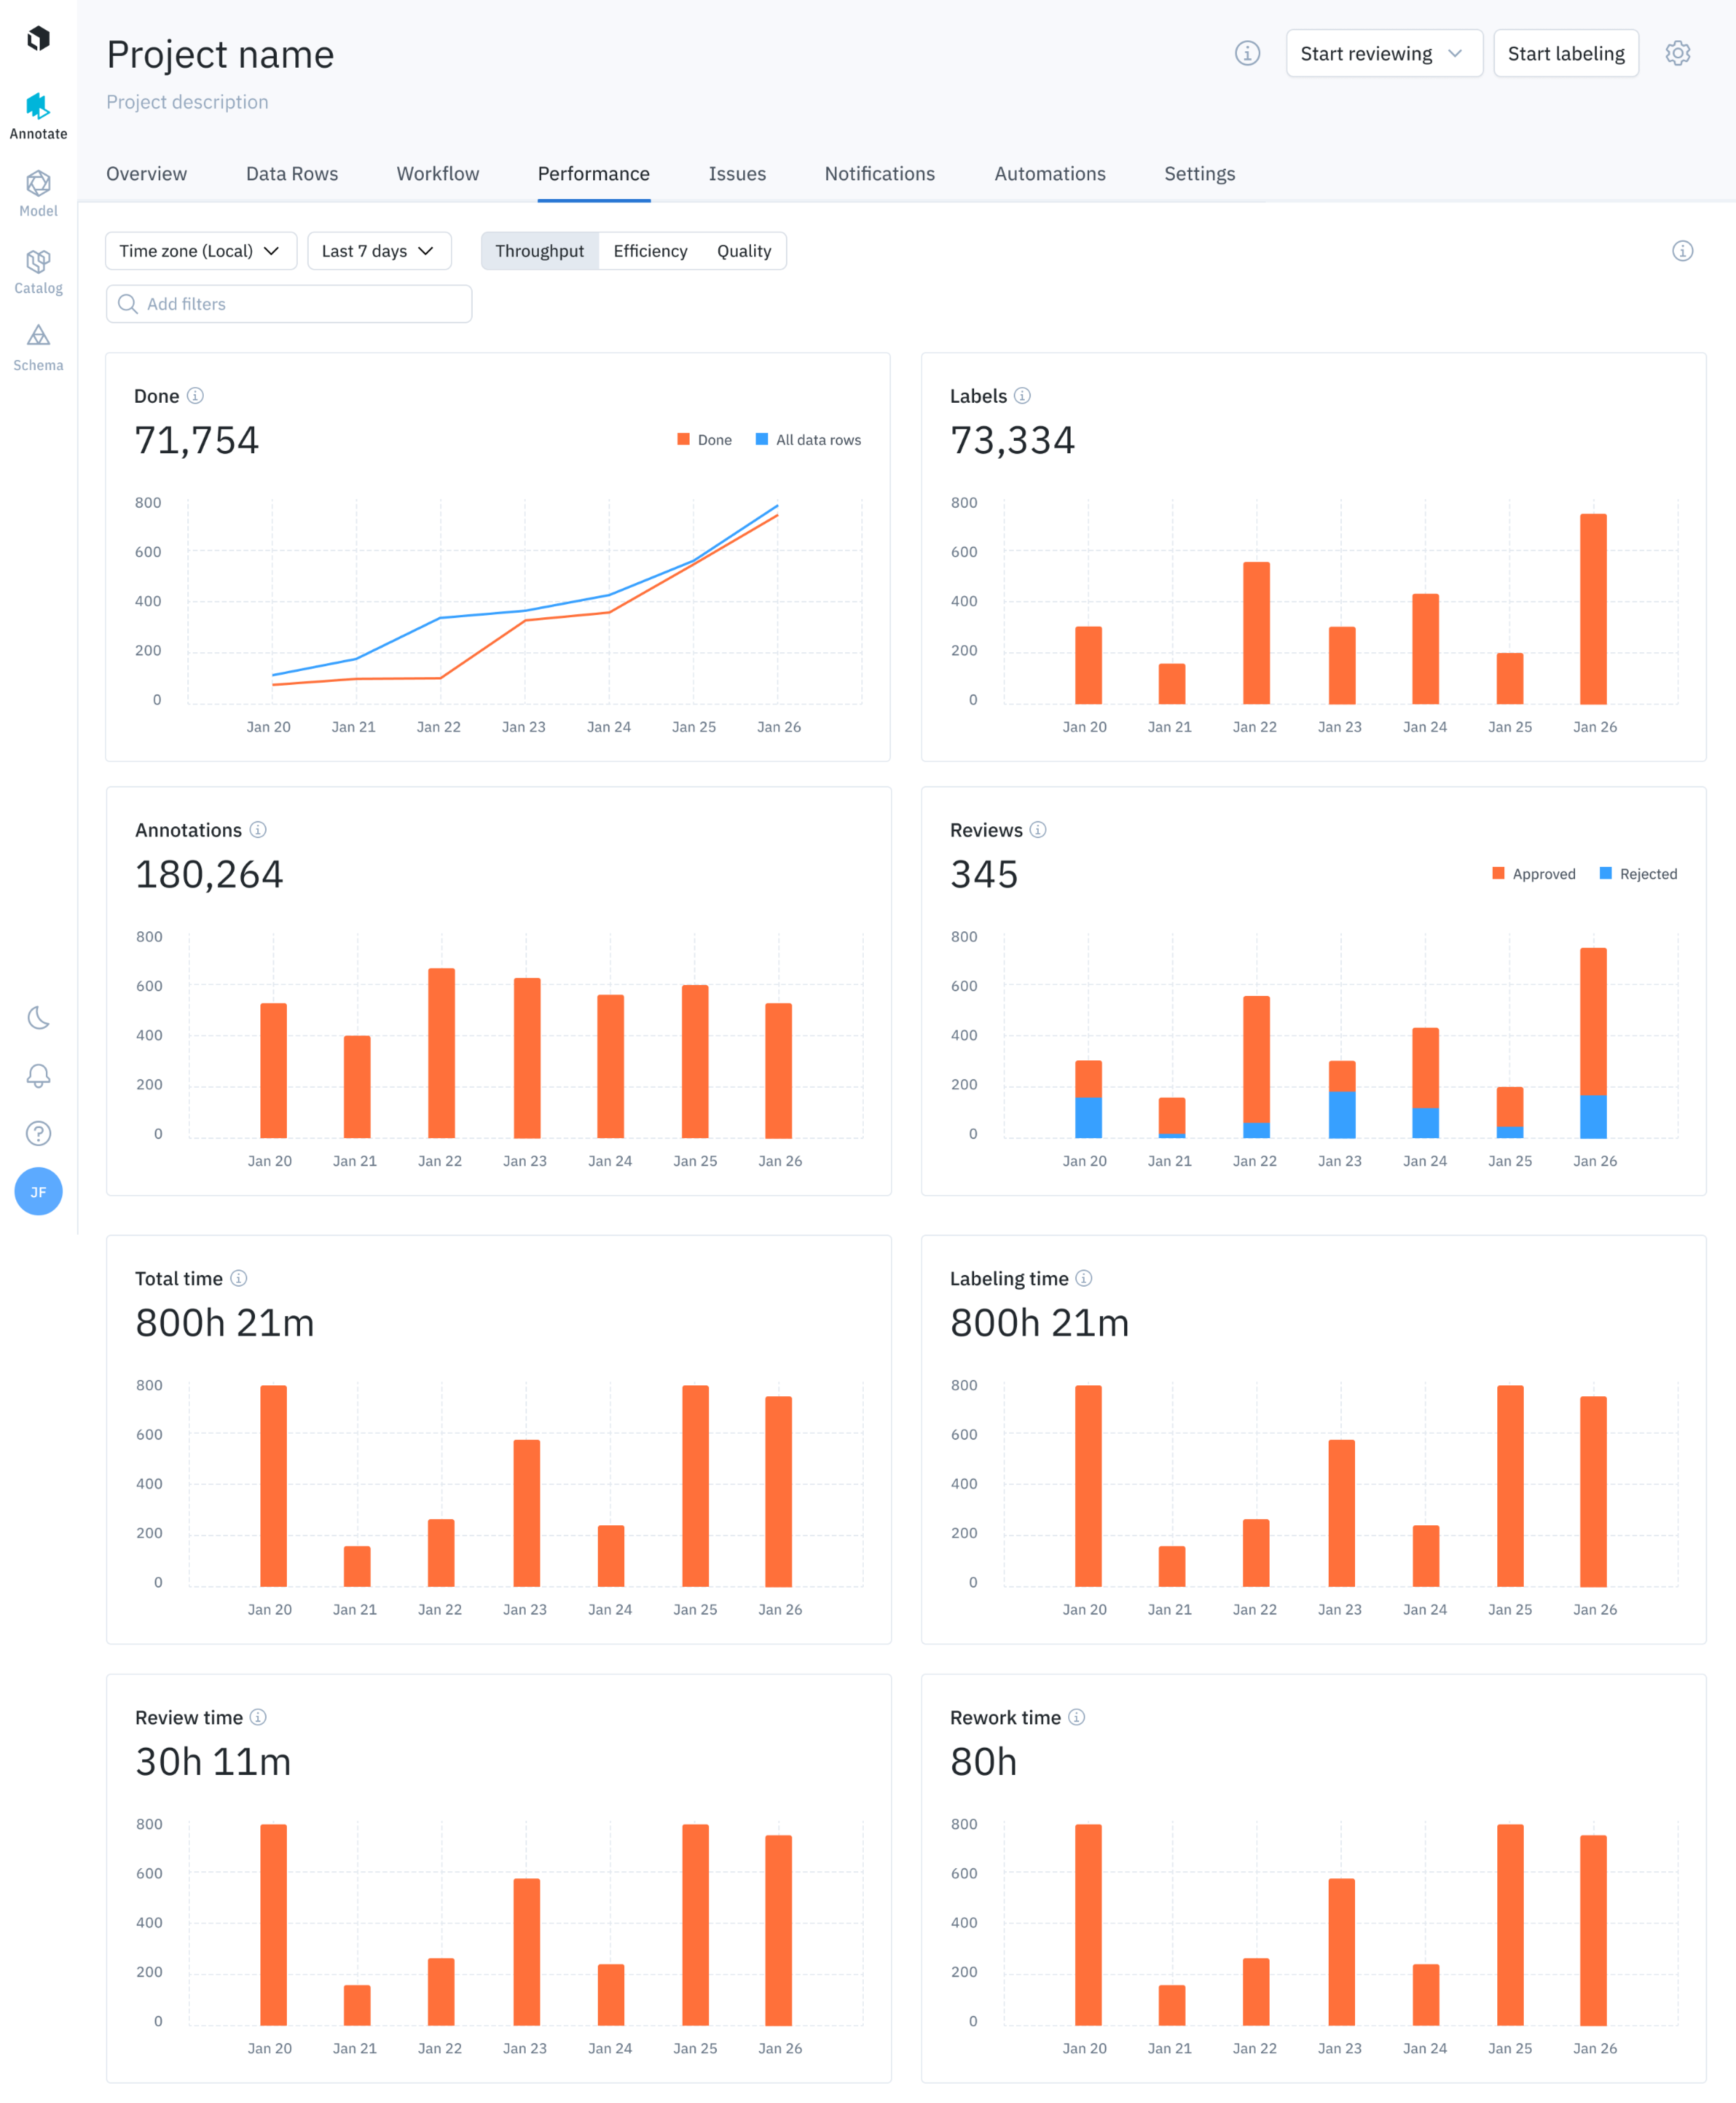
The performance dashboard displays throughput graphs
The performance dashboard helps manage labeling operations in Labelbox projects. It reports the throughput, efficiency, and quality of the labeling process. These analytics are reported at the overall project level and at an individual level. You can use filters to focus on specific information and dimensions.
The performance of your data labeling operation can be broken down into three components: throughput, efficiency, and quality. Each component has unique views to help you understand the overall performance of your labeling operation.
Use the mouse to select and display details for any graph value.
Filters
Filters at the top of the performance dashboard allow you to analyze relevant subsets of data. Note that the selection applies to all tabs, including Throughput, Efficiency, and Quality.
Currently, the following filters are provided:
| Filter | Description |
|---|---|
| Batch | Filters the graphs and metrics by data rows belonging to a batch. |
| Labelers | Filters the graphs and metrics by data rows that have been labeled by a specific labeler. |
| Deleted | Filters the graphs and metrics by data rows based on their deletion status. - Exclude: This subfilter excludes the data rows with labels that have been deleted. - Include: This subfilter includes all labels created in the project, including the ones with deleted labels. |
Throughput view
The throughput view provides insight into the amount of labeling work being produced, which helps you answer questions like:
- How many assets were labeled in the last 30 days?
- How much time is being spent reviewing and reworking labeled assets?
- What is the average amount of labeling work being produced?
The metrics shown above are available for all members of the project and for individual members.
The throughput view displays the following metrics:
| Chart | Description |
|---|---|
| Done | Displays the number of data rows with the Done status (see Workflows for status definitions) compared to the total number of data rows in the project, over a specified time period (cumulative). |
| Labels | Displays the number of labeled data rows over a specified time period (includes deleted labels by default). |
| Annotations | Displays the number of annotations created (includes deleted annotations by default). |
| Reviews | Displays the count of approve and reject actions committed in a project (for information on approve & reject actions in the review queue, see Workflows). |
| Total time | Displays the total time spent labeling, reviewing, and reworking data rows. |
| Labeling time | Displays the total time spent labeling data rows. See the flowchart below. |
| Review time | Displays the total time spent reviewing labeled data rows. See the flowchart below. |
| Rework time | Displays the total time spent reworking labeled data rows. See the flowchart below. Note: this includes time spent outside of the Rework queue in Workflows as well. |
Inactivity pauses timer
Labelbox only records active screen time. When the system detects 5 minutes of inactivity, Labelbox will pause the timer for review/label time. When the system detects actvity again, Labelbox will resume the timer.
Tracking states for timing
A data row goes through many different states. Consequently, the timer log accounts for the various states of a data row. The flowchart below illustrates the various steps in the complete data row journey in Annotate. This data flow informs the associated timer log for measuring labeling, rework, and review time.
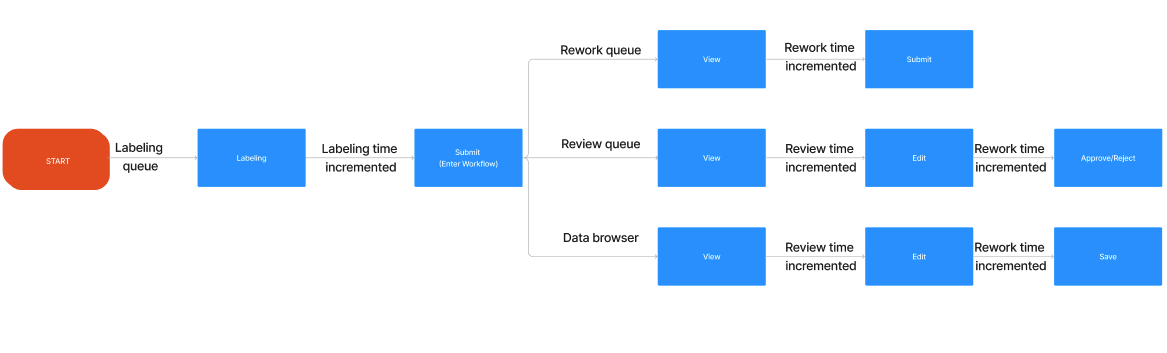
Tracking flow of a data row and associated time long across labeling, review, and rework
Efficiency view
The efficiency view helps you visualize the time spent per unit of work (e.g., per labeled asset or per review). The metrics in this section help you answer the following questions:
- What is the average amount of time spent labeling an asset?
- How can I reduce time spent per labeled asset?
The metrics shown are available at the project level (i.e., across all members of the project) and at the individual level. Here are the descriptions for each chart in the efficiency view.
| Chart | Description |
|---|---|
| Avg time per label | Displays the average labeling time spent per label. I.e., Avg time per label = Total labeling time/number of labels submitted |
| Avg review time | Displays the average review time per data row. I.e., Avg review time = Total review time/number of data rows reviewed |
| Avg rework time | Displays the average rework time per data row. I.e., Avg rework time = Total rework time/number of data rows reworked |
Quality view
The quality view helps you understand the accuracy and consistency of the labeling work being produced. The metrics in this section help you answer questions like:
- What is the average quality of a labeled asset?
- How can I ensure label quality is more consistent across the team?
The metrics shown are available at the project level (i.e., across all members of the project) and at the individual level. Below are the descriptions for each chart in the quality view. Note that only relevant dashboard components will appear depending on whether you have benchmarks or consensus set up. Click on the bars in the chart to open that subset of data in the data rows tab.
| Metric | Description |
|---|---|
| Benchmark | Shows the average benchmark scores on labeled data rows within a specified time frame. |
| Benchmark distribution | Shows a histogram of benchmark scores (grouped by 10) for labeled assets within a specified time frame. |
| Consensus | Shows the average consensus score of labeled assets over a selected period. This is the average agreement score of consensus labels within themselves (for a given data row). |
| Consensus distribution | Shows a histogram of consensus scores (grouped by 10) for labeled assets plotted over the selected period. |
Individual member performance
In addition to displaying aggregate metrics, Labelbox tracks individual metrics for each team member that has worked on the project. The performance metrics are separated by intent ( labeling and reviewing) and are shown as distinct subtabs in the table.
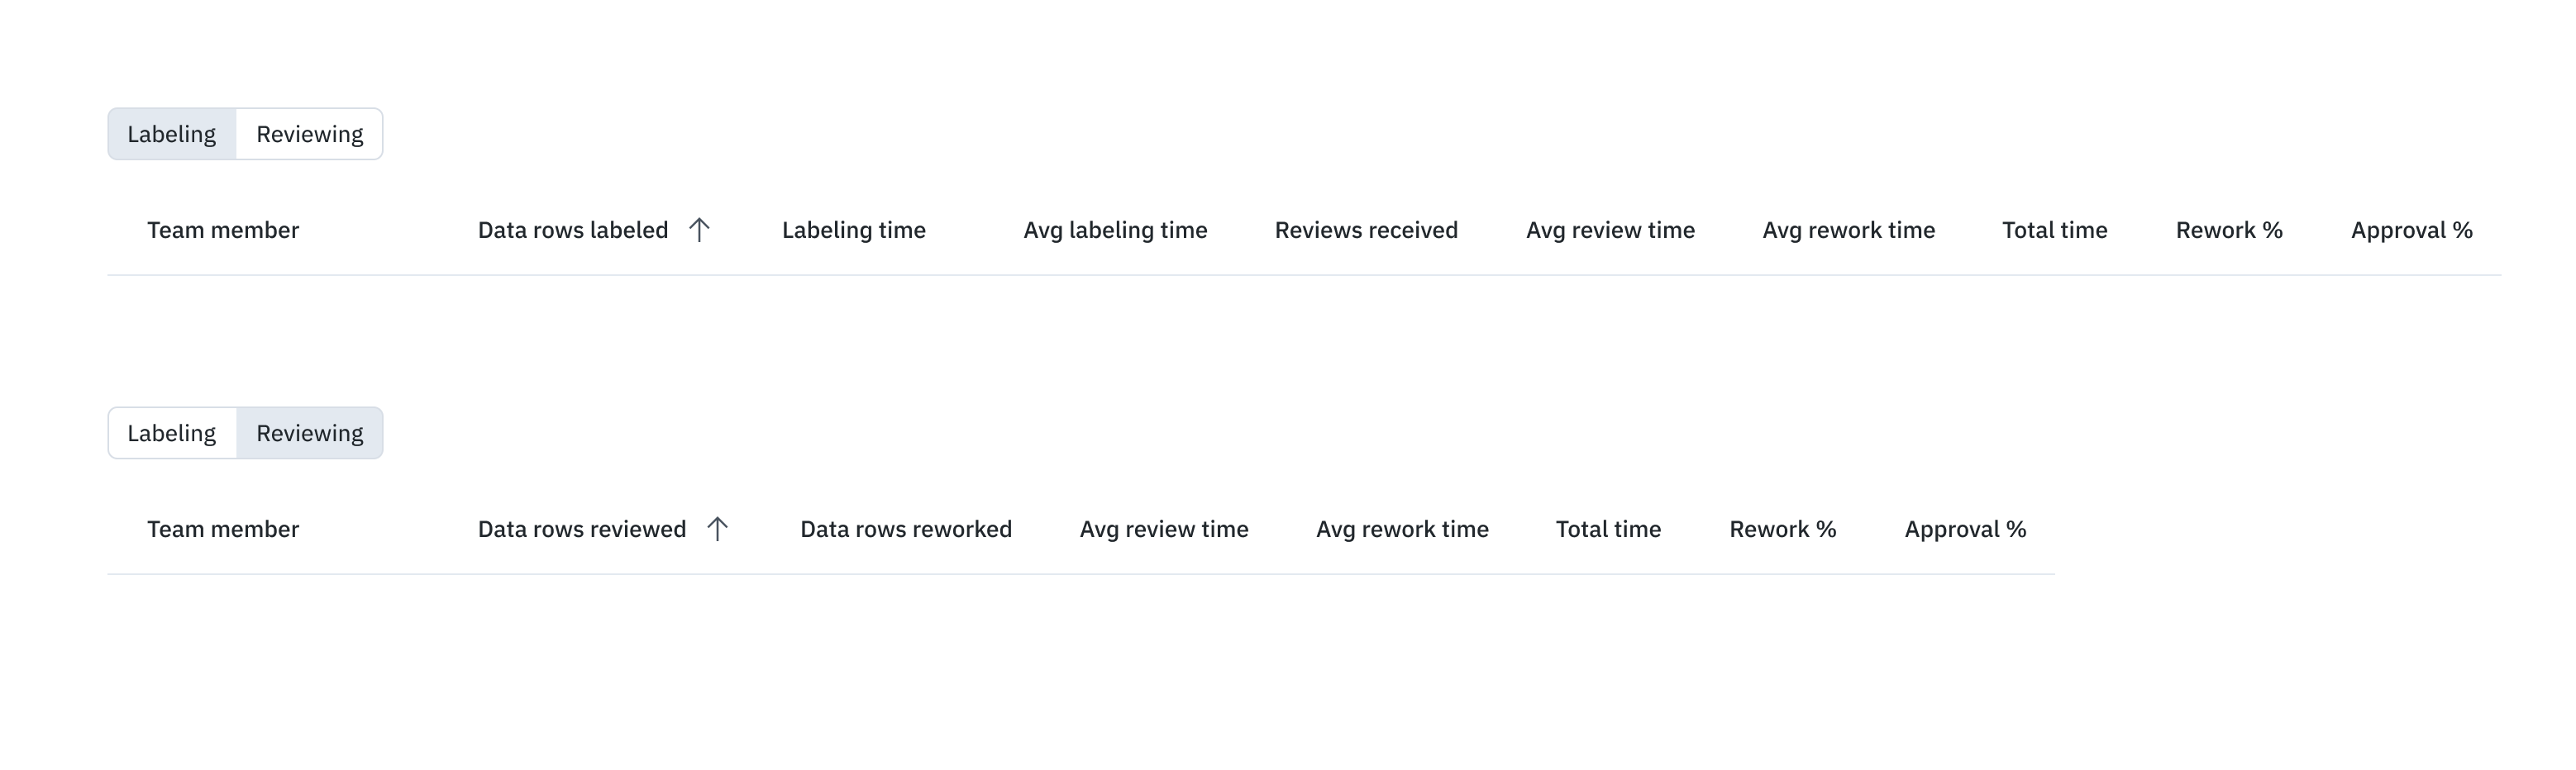
Team members are listed individually in separate rows; members only appear if they actively peformed tasks during the selected period; that is, they only show up if they labeled data rows or reviewed labels.
Labeling metrics include:
| Metric (Labeling) | Description |
|---|---|
| Labels created | Number of labels created by team member during the selected period. |
| Labels skipped | Number of labels skipped by team member during the selected period. |
| Labeling time (submitted) | Total time team member spent creating and submitting labels during the selected period. |
| Labeling time (skipped) | Total time team member spent working on labels that were ultimately skipped. (The Skip button was clicked.) |
| Avg time per label | Average labeling time of submitted and skipped labels. Calculated by dividing total labeling time by the number of labels submitted or skipped. Displays N/A when no labels have been submitted or skipped. |
| Reviews received | The number of Workflow review queue actions ( Approve and Reject) received during the selected period on data rows labeled by the team member. |
| Avg review time (all) | Average review time by all team members during the selected period. Calculated by dividing the total review time for all team members by the number of labels that have been reviewed. |
| Avg rework time (all) | Average rework time on labels created by the team member. Calculated by dividing the total time spent by the number of labels reworked. |
| Rework time (all) | Total time during the selected period spent reworking labels created by the team member. |
| Review time (all) | Total time spent reviewing labels created by the team member during the selected update. |
| Rework % | Percentage of labels created by the team member that were reworked during the select time period. Calculated by dividing the number of labels created by the team member that had any rework done by the number of labels created by the team member. |
| Approval % | Percentage of data rows labeled by the team member that were approved during the selected period. Calculated by dividing the number of data rows with one or more approved labels by the number of review actions (Approve or Reject). Labels pending review are not included. |
| Benchmark score | Average agreement score with benchmark labels for labels created by the team member during the selected period. |
| Consensus score | Average agreement score with other consensus labels for labels created by the team member during the selected period. |
Here are the metrics that are shown on the Reviewing tab:
| Metric (Reviewing) | Description |
|---|---|
| Data rows reviewed | Data rows that have had review time spent by the user (per filter selection). |
| Data rows reworked | Data rows that have had rework time spent by the user. |
| Avg review time | Average review time spent by the user in the period selected. Numerator = Total review time spent across data rows with ANY review time spent by the user Denominator = Number of data rows with ANY review time spent by the user |
| Avg rework time | Average rework time spent by the user in the period selected. Numerator = Total rework time spent across data rows with ANY review time spent by the user Denominator = Number of data rows with ANY review time spent by the user |
| Total time | Sum of Review and Rework time spent by the user during the period selected. |
| Rework % | %of Data rows reviewed by the user that have been reworked. Numerator = Number of data rows that have had rework and review time spent by the user Denominator = Number of data rows that have had review time spent by the user |
| Approval % | Data rows with an approve action by the user as a % of data rows with any review action by the user. Numerator = Number of data rows with approve action by the user (in workflow) Denominator = Number of data rows with either an approve or reject action by the user (in workflow) |
FAQs
How does the timer work when labels are imported as ground truth?
If a label is imported as ground truth, the label time will appear as zero on the data rows tab. The label time will also appear as zero on the performance dashboard. When a team member modifies the label, any time spent will be recorded as review time.
How does the timer work when labels are imported as pre-labels (MAL)?
If a label is imported as a pre-label via MAL, the label time will appear as zero on the data rows tab and the performance dashboard. When a team member opens the data row containing the pre-label in the editor, the time spent before they select skip or submit will be recorded as label time.
Updated 27 days ago