Monitor labeling performance

Monitor the performance of your labeling project and labeling service workforce.

The Monitor page allows you to monitor labeling operations and performance across all projects in real-time. It provides filters and visualizations to help you identify outlier labelers and make decisions to improve productivity and efficiency.

The Monitor page has the following sections:

  • Project Performance: Shows performance metrics for each project, allowing you to monitor and analyze performance at the project level.
  • Member performance: Shows performance metrics for individual labelers, allowing you to assess and compare the performance of each team member, including your own and requested labeling services workforce.
  • Performance charts: Visualizes key performance metrics indicating the throughput, efficiency, and quality of the labeling process, including all charts available on the performance dashboard.

📘

Enterprise only feature

Only organizations on the enterprise plan can access the Monitor page. To upgrade to the enterprise plan, please contact sales.

Performance metrics

The Monitor page displays metrics in the following categories:

  • Throughput: Tracks the volume of labeling, annotation, and review activities over time.
  • Efficiency: Measures the time taken for labeling, reviewing, and rework activities to assess process efficiency.
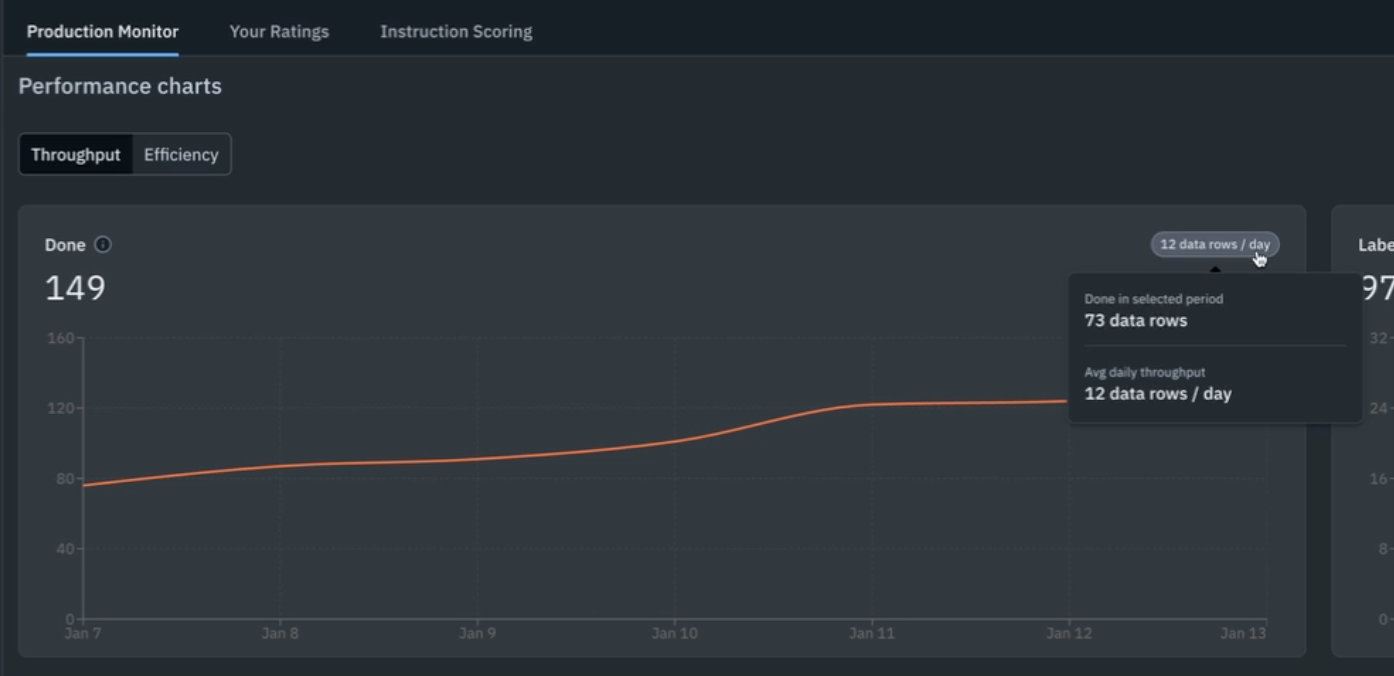
  • Quality: Evaluates labeling accuracy and consistency through benchmark and consensus agreement scores.

By default, the page displays all available metrics, but you can adjust the number, order, and density of metrics displayed on the performance tables and charts. Each metric automatically detects and highlights outlier data for your attention. For example, if you see a decline in quality scores, you can quickly investigate and take corrective action, such as redistributing tasks or providing additional guidance to your team. You can also apply these metrics as filters to find certain projects and members.

Throughput

The Monitor page has the following throughput metrics:

MetricDescription
Project countThe number of projects the member contributed to in the period selected. Only available on Member Performance.
Member countThe number of members contributing to the project in the period selected. Only available on Project Performance.
Labels createdThe number of labeled data rows over a specified time period, including deleted labels by default.
Annotations createdThe number of annotations (features) created over a specified time period, including deleted annotations by default.
Reviews receivedThe count of approve and reject actions performed on labeled data rows within a project.
Total timeThe total time spent on labeling, reviewing, and reworking data rows.
Labeling timeThe total time spent labeling data rows. Time increments when a labeler skips or submits an asset in the labeling queue.
Review timeThe total time spent reviewing labeled data rows. Time increments when a reviewer views an asset in the review queue or in the data row browser view.
Rework timeThe total time spent on reworking labeled data rows. Time increments when a labeler submits an asset in the rework queue, navigates to the review queue to make edits, or approves/rejects the asset in the data row browser view.
ApprovalThe percentage of data rows labeled by the member that received an Approve action in the period selected.

Efficiency

The Monitor page has the following efficiency metrics, which are calculated by throughput metrics:

MetricDescription
Avg time per labelThe average labeling time spent per label.
Avg time per label = Total labeling time / number of labels submitted
Avg review timeThe average review time per data row.
Avg review time = Total review time / number of data rows reviewed
Avg rework timeThe average rework time per data row.
Avg rework time = Total rework time/ number of data rows reworked

Quality

The Monitor page has the following quality metrics:

MetricDescription
Benchmark scoreThe average benchmark scores on labeled data rows within a specified time frame.
Consensus scoreThe average consensus score of labeled assets over a selected period. This is the average agreement score of consensus labels within themselves (for a given data row).