- Individual
- TEQ (Throughput, Efficiency, and Quality)
- Participation
- Instruction Quiz (see Quiz)
Throughput, efficiency, and quality (TEQ)
This section provides three separate views to help you understand the performance of your labeling operation: Throughput, Efficiency, and Quality.Throughput view
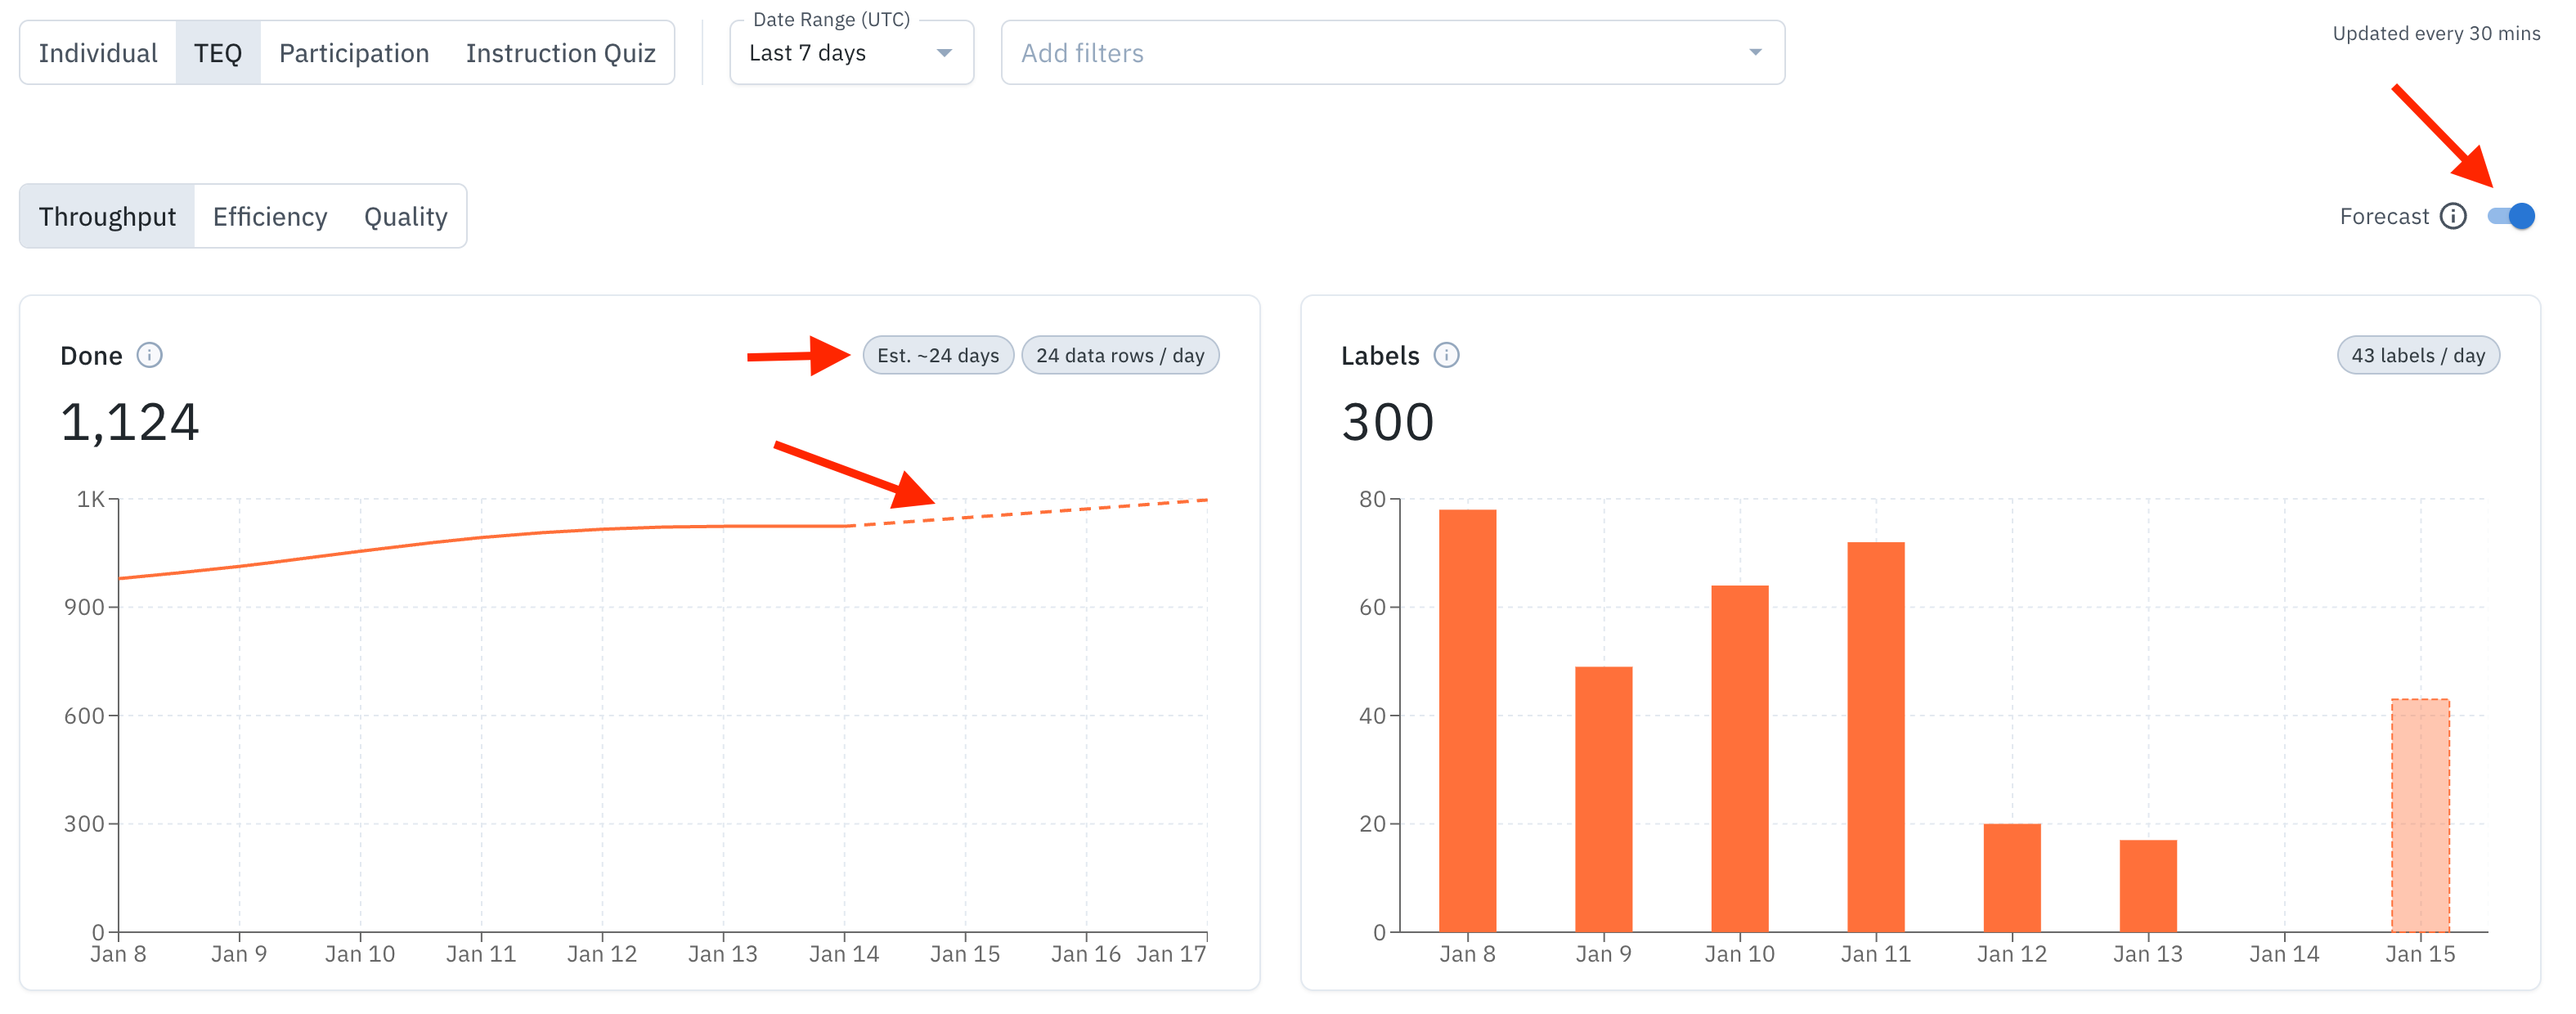
The throughput view provides insight into the amount of labeling work being produced and helps you answer questions like:- How many assets were labeled in the last 30 days?
- What is the review time and rework time for labeled assets?
- What is the average amount of labeling work being produced?
Forecast
The forecast feature shows your average daily throughput and completed work (data rows, labels, reviews, annotations) and uses that to forecast completion dates. To see this, enable the Forecast toggle.Average daily throughput
The average daily throughput is calculated by dividing the total units completed in the selected date range by the number of calendar days in that range. Where:- Total units completed = sum of the relevant throughput metric over the selected period (e.g., total labels created, total reviews, etc)
- Number of calendar days = inclusive of days between start and end date (e.g., Jan 1–Jan 7 → 7 days). This aligns the “average per day” with how the forecast projects completion over calendar time.
- For Labels created / Reviews received / Annotations created, average daily throughput is in units like “labels/day”, “reviews/day”, “annotations/day”.
- For time-based metrics, the forecast uses those as inputs, but the primary “average daily throughput” surfaced is for the count-based metrics (data rows/labels/reviews/annotations), per the spec and launch comms.
Efficiency view
The efficiency view helps you visualize the time spent per unit of work, per labeled asset, or per review. These metrics help answer questions such as:- What is the average amount of time spent labeling an asset?
- How can I reduce the time spent per labeled asset?
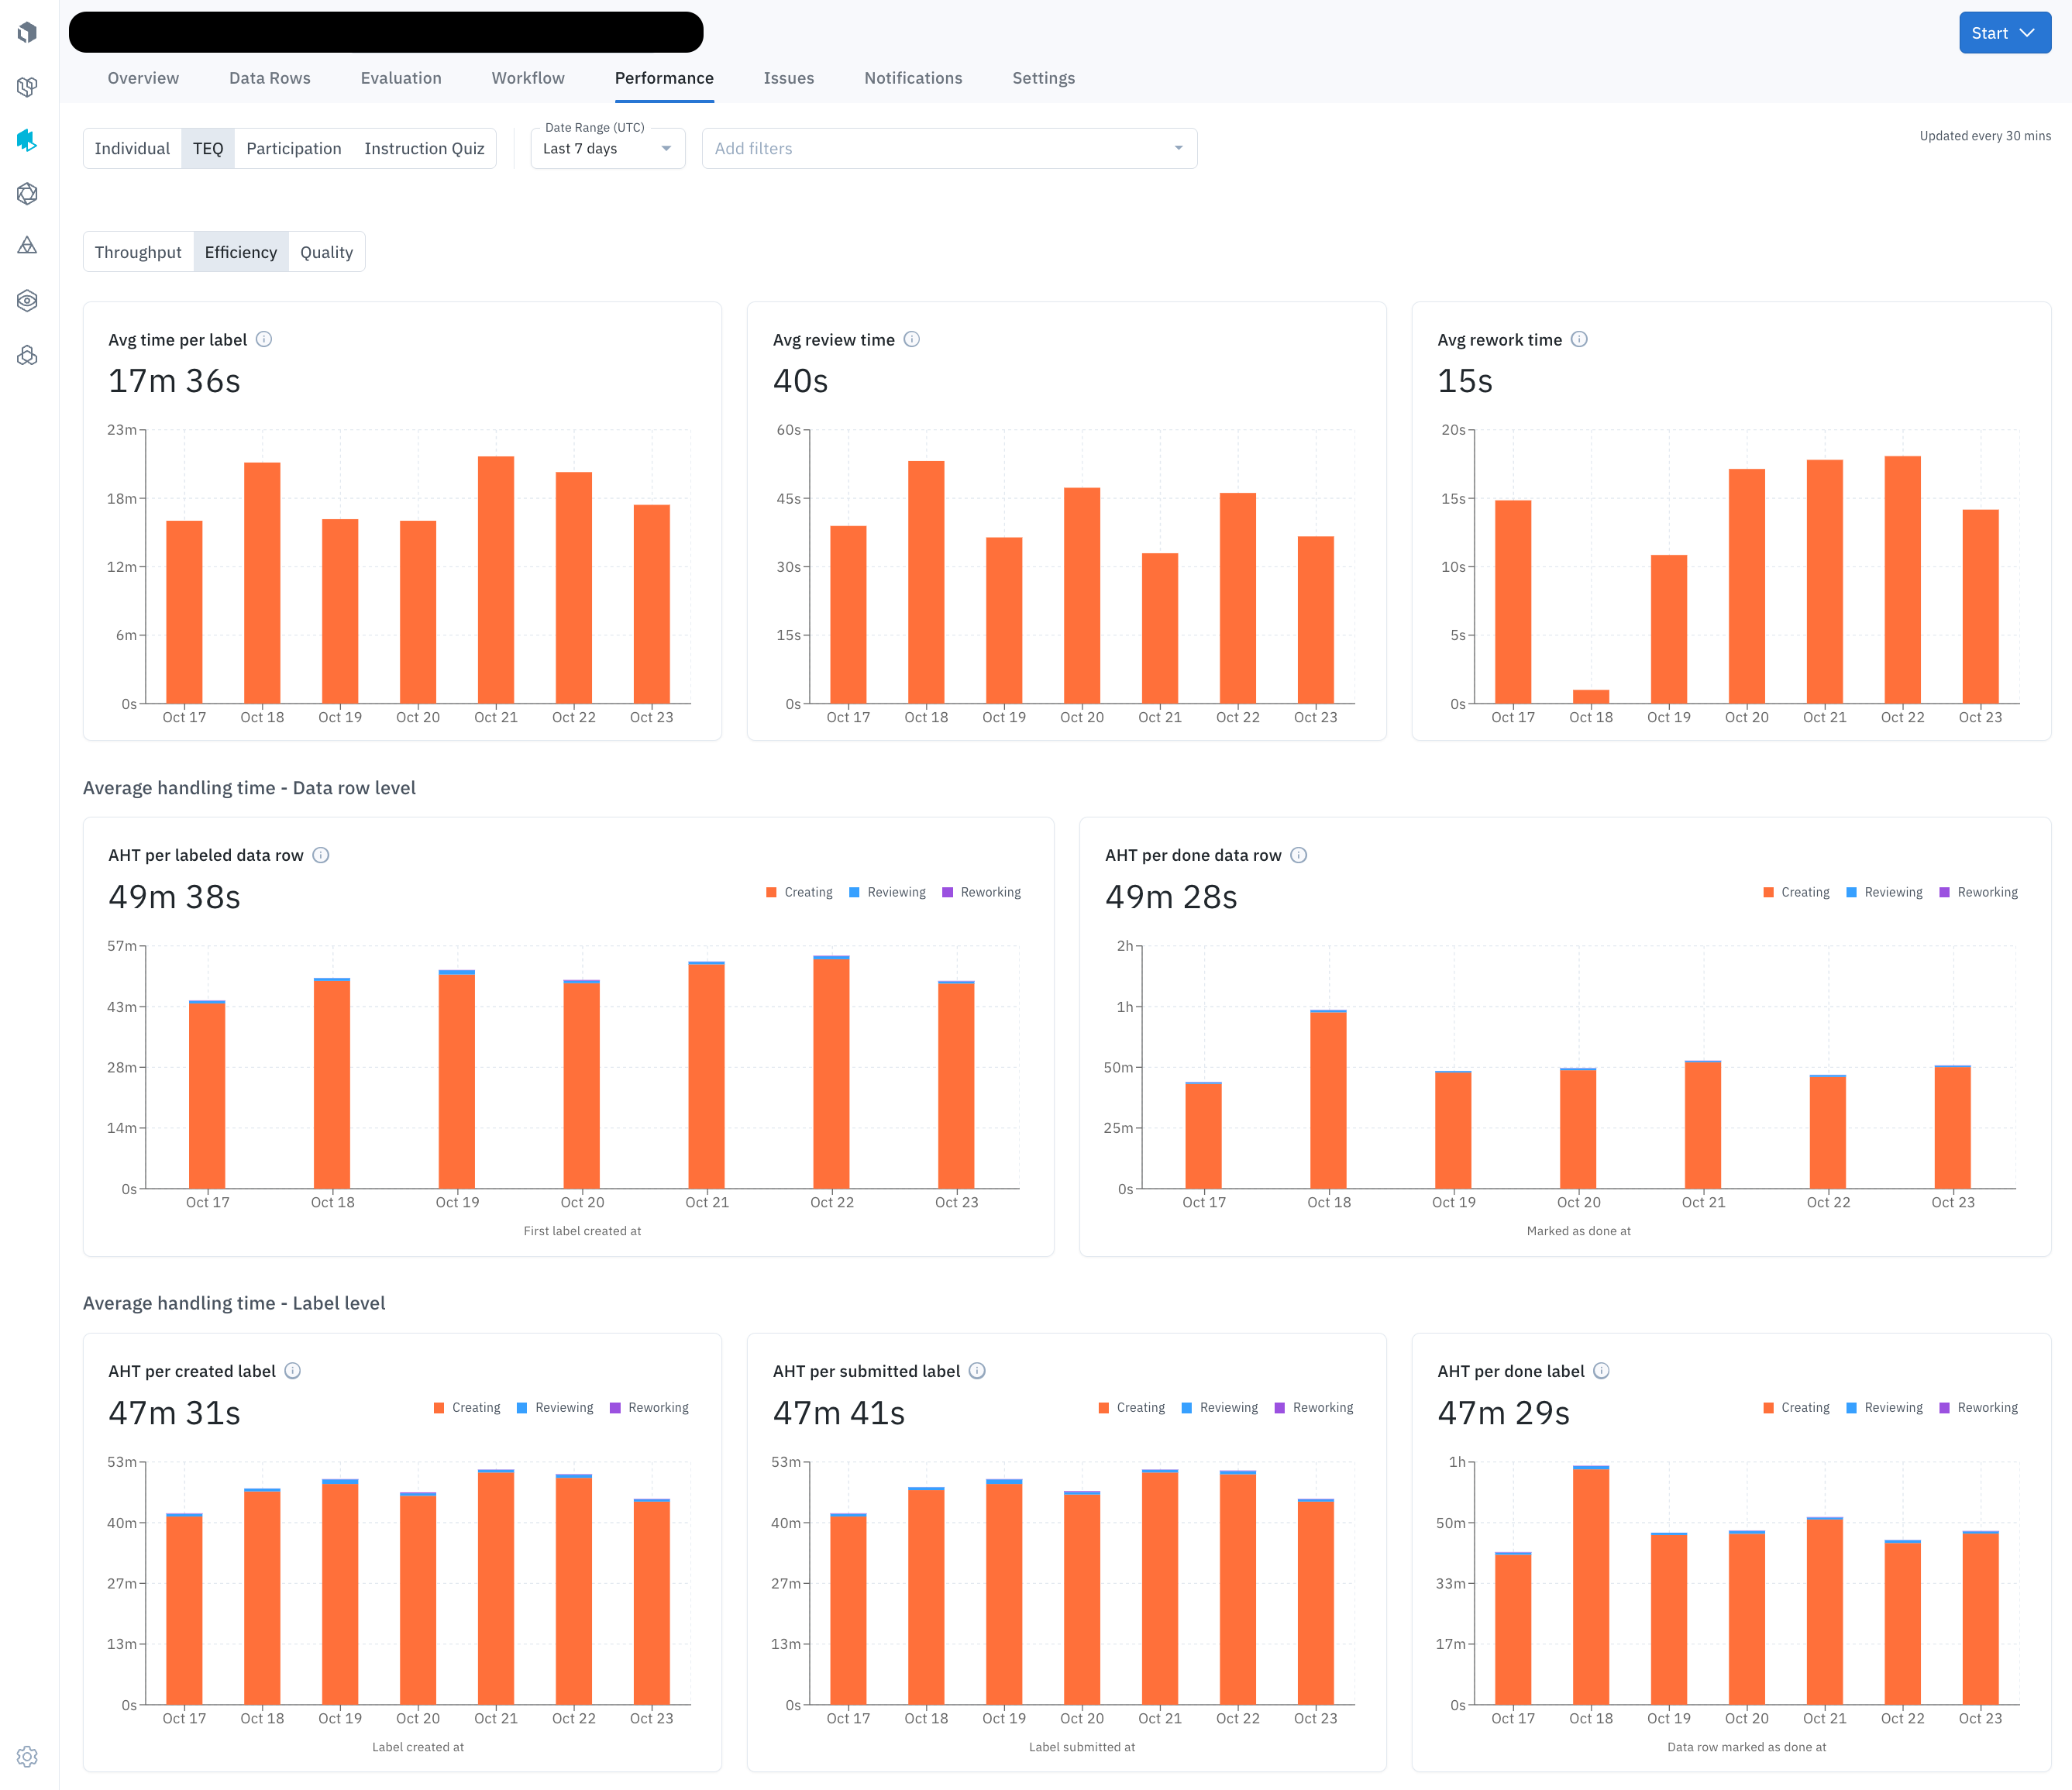
“Skipped” time is excluded from labeling time, and “abandoned” (unsaved) work is counted toward labeling time. You can use filters to include or exclude time spent on “deleted” labels.
Quality view
The quality view helps you understand the accuracy and consistency of the labeling work being produced. These metrics answer questions like:- What is the average quality of a labeled asset?
- How can I ensure label quality is more consistent across the team?
Individual member performance
Click Individual in the Performance dashboard to view individual metrics for each team member that has worked on the project. The performance metrics are separated by intent (labeling and reviewing) and are shown as distinct views in the table. Team members are listed individually in separate rows and will only appear if they have actively performed tasks during the selected period.Labeling metrics
Here are the metrics displayed in the Individual → Labeling view.Reviewing metrics
Here are the metrics displayed in the Individual → Reviewing view.Participation histogram
The Participation histogram is a chart in the Performance Dashboard that visualizes the distribution of labeler activity across a project.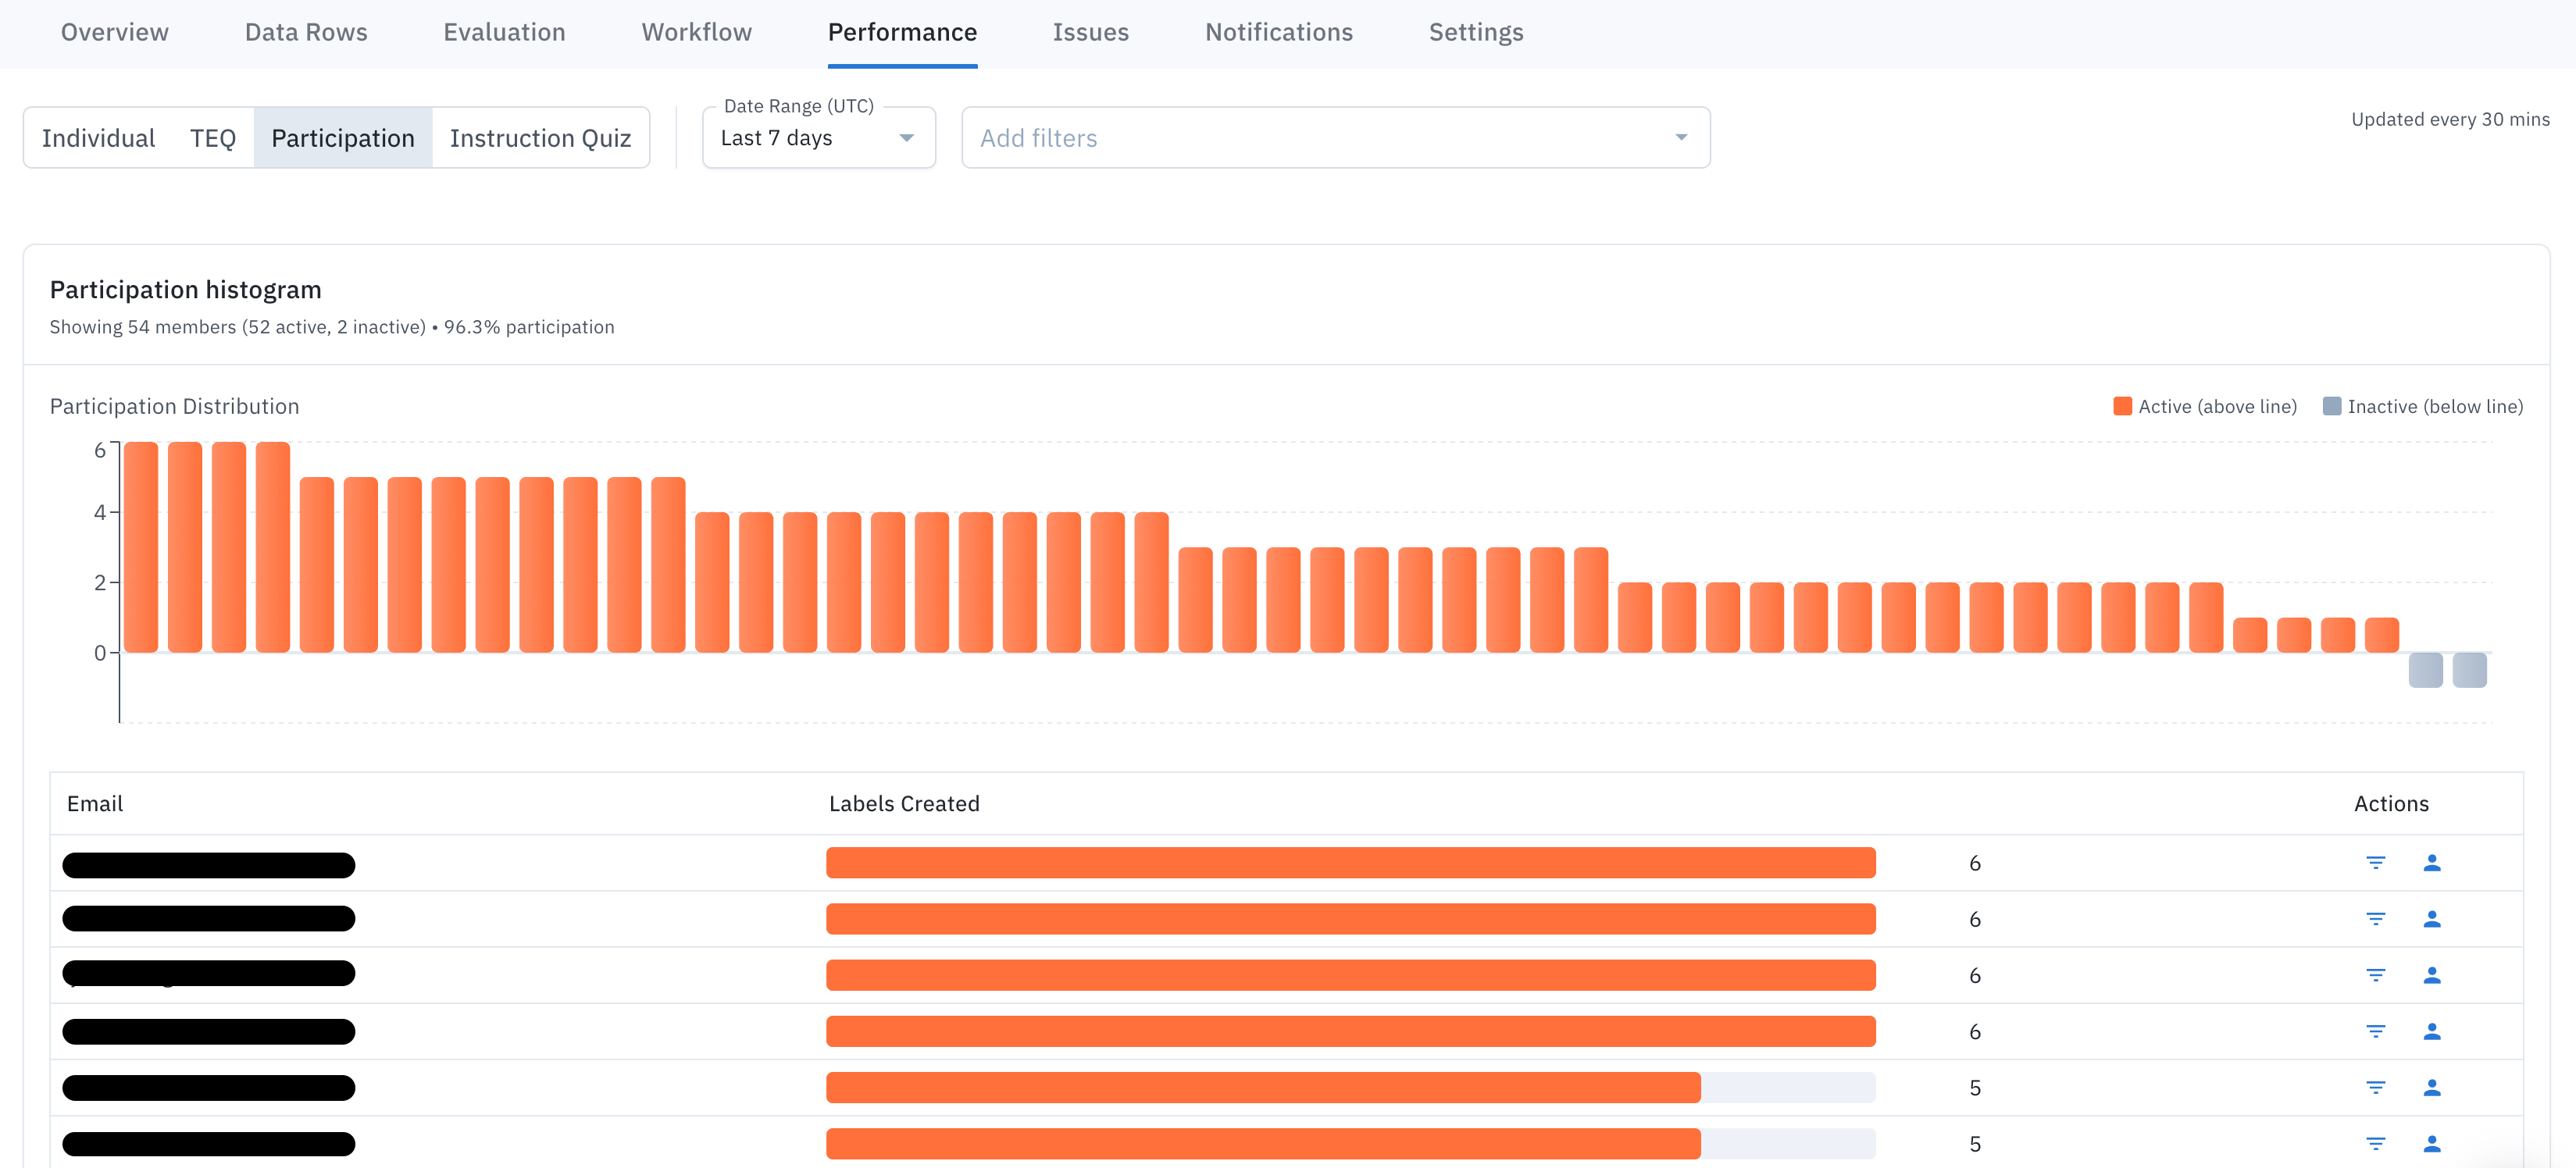
- How many labelers fall into different activity buckets (e.g., by number of tasks completed or labels created)
- It helps admins see at a glance whether participation is concentrated among a few heavy contributors or spread evenly across the workforce
- Labelers who haven’t participated at all
- Labelers who are highly active vs. barely active
- Overall workforce engagement health for a project
Timer details
To help you measure efficiency, the timer log tracks how much time is spent on each data row. The time is broken down into three categories: labeling, reviewing, and reworking.How time is tracked in your project
A data row goes through many different states, which are tracked in the timer log.Important notes
- Inactivity Pause: If a user is inactive for more than five minutes, the timer will automatically pause. It will resume as soon as they become active again.
- Consensus and Benchmarks: If your project uses consensus or benchmarks, the time recorded for a data row will be the total time spent across all labels created for that data row.
How importing labels impacts the timer
Importing labels affects labeling time. When you import:- Ground truth labels: No label time is recorded on the Data rows tab or the performance dashboard for that label. Label time is displayed as zero (0). When team members modify the label, time is recorded as review time.
- Model-assisted learning (MAL) pre-labels: No label time is recorded on the Data rows tab or the performance dashboard for that label. Label time is displayed as zero (0). When team members open the data row in the editor and click Edit, the time spent before selecting Skip or Submit is recorded as labeling time.