What can you do with Catalog?
- Visualize and explore your data to uncover insights: Instead of guessing what’s in your dataset, you can directly visualize it. Spot imbalances, identify outliers, find rare edge cases, and understand the distribution of your data before it ever touches a model. Use the gallery view for a visual survey, the list view for metadata analysis, and the analytics view to see statistical breakdowns.
- Find specific data with powerful search and filtering: Move beyond simple filename searches. Catalog allows you to build complex queries to find the exact data you need. You can filter by a rich set of attributes including metadata, annotation-class, dataset, project, and even the content of the data itself using AI-powered search methods.
- Curate and organize datasets for any workflow: Your raw data is just the beginning. Catalog helps you organize it for specific tasks. You can create static batches of data to send to a labeling project or define dynamic slices that automatically track specific subsets of your data over time, like “all images flagged for review.”
- Take targeted action on your data: Finding data is only half the battle. Catalog is fully integrated with the rest of the Labelbox platform, allowing you to take immediate action on your findings. Select a group of data rows and, with a few clicks, you can add metadata, export them for analysis, or send them directly to a labeling project.
Key concepts
To effectively navigate and use Catalog, it’s important to understand its core components. These are the fundamental building blocks you’ll encounter as you explore and manage your data.Gallery view
The gallery view is the default, providing a visual grid of your data. It’s designed for rapid visual scanning and exploration.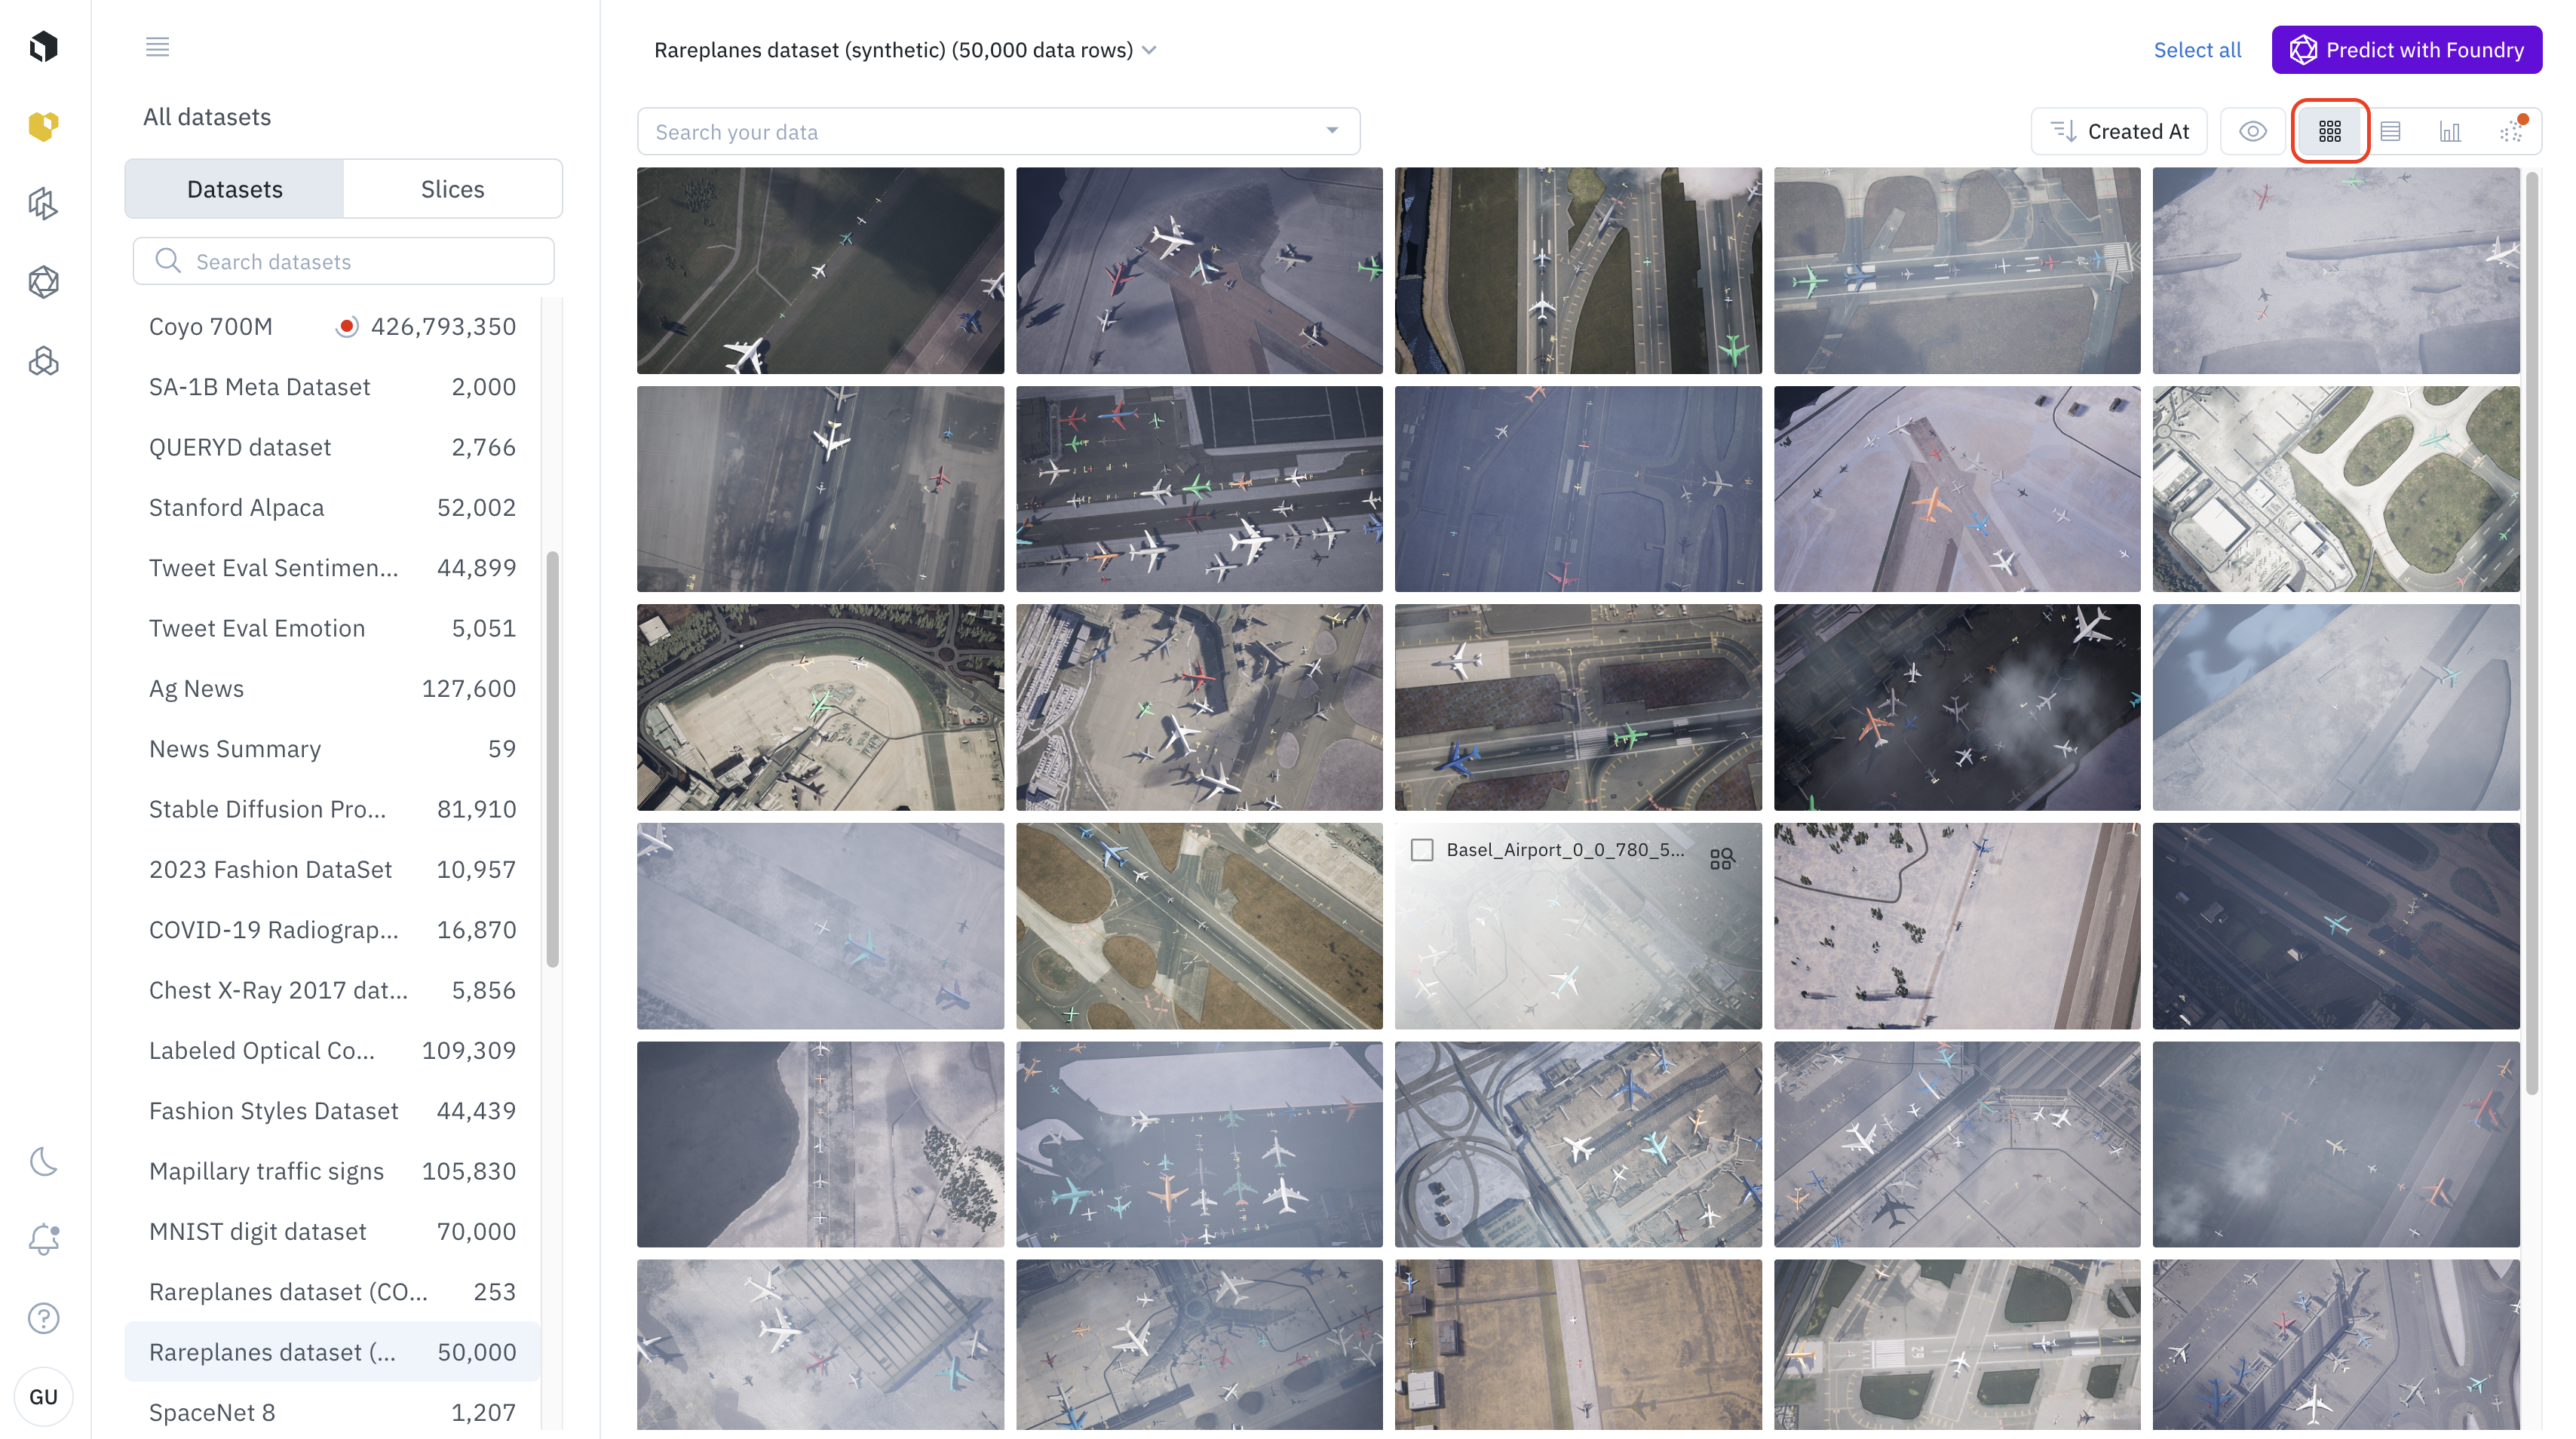
- Best for: Getting a high-level visual sense of your dataset, spotting visual outliers, discovering trends, and making quick selections based on what the data looks like.
- How to use it: Simply scroll through the grid to explore. You can click on any data row to open the detailed view or use
Shift + Clickto select a range of items.
List view
The list view organizes your data rows in a familiar table format, emphasizing metadata over visual appearance.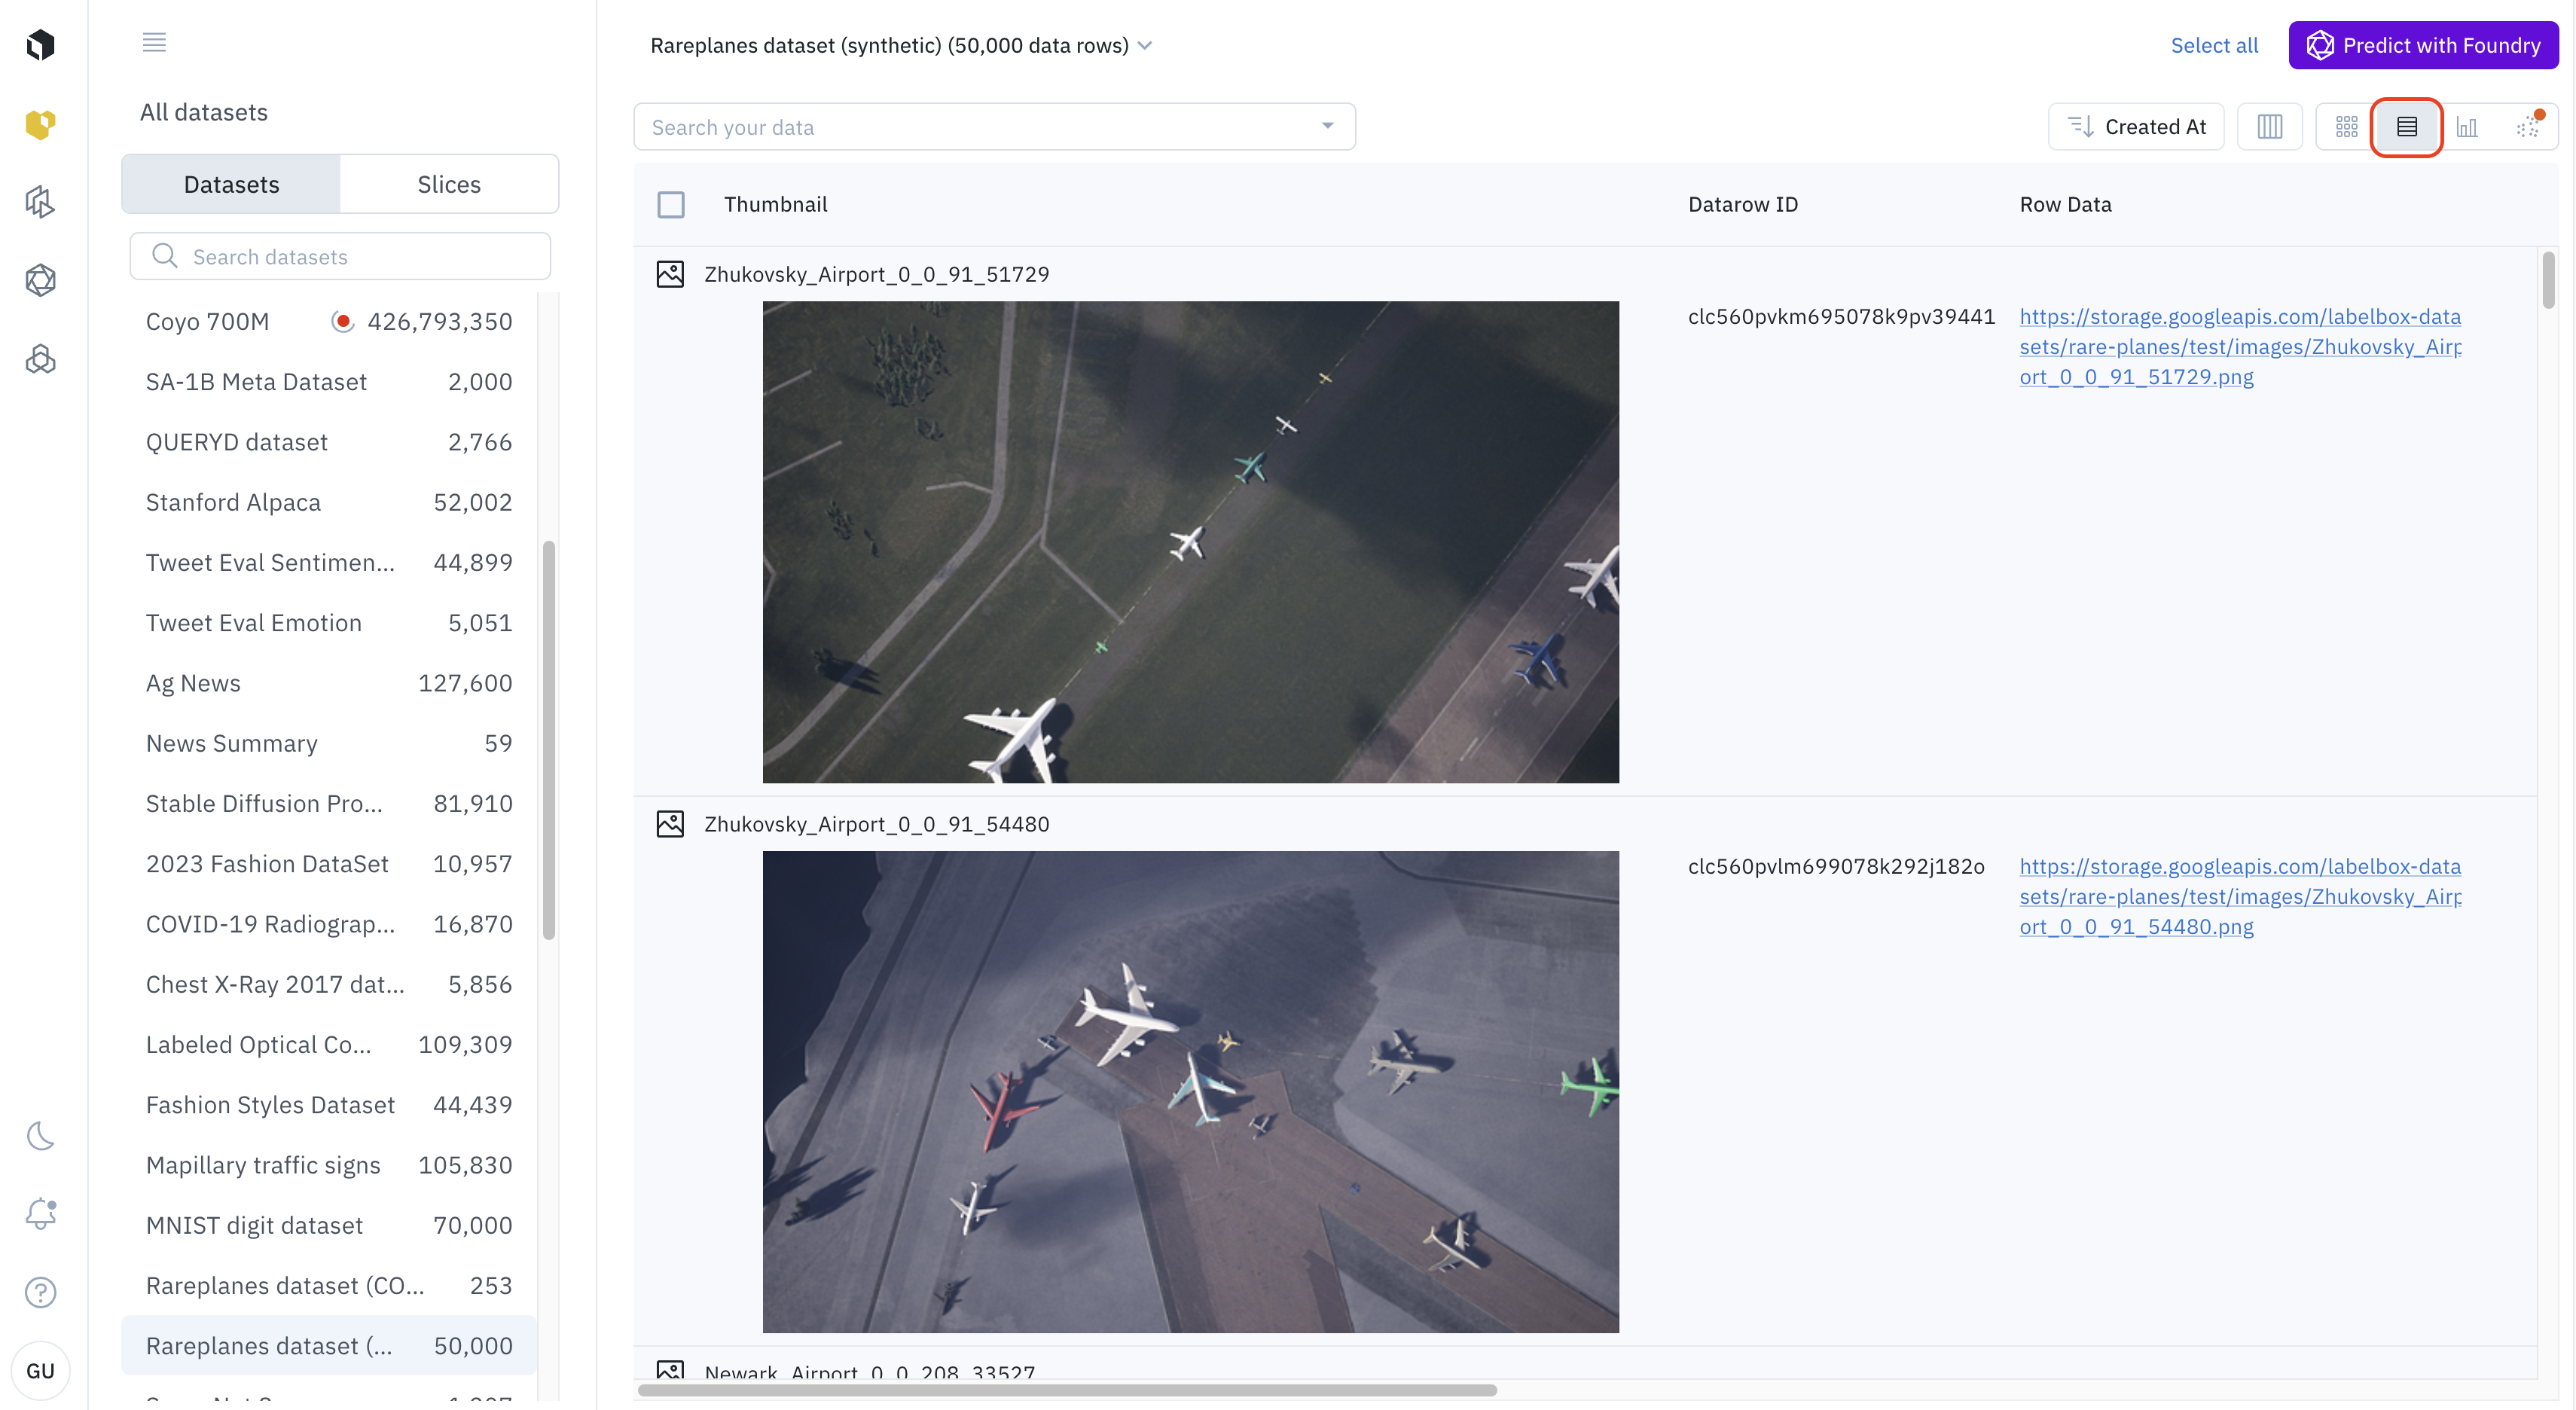
- Best for: Analyzing and sorting your data by specific metadata attributes, comparing values across data rows, and finding data with specific metadata characteristics.
- How to use it:
- Switch to the list view using the view-selector icon.
- Click on any column header to sort the data by that attribute.
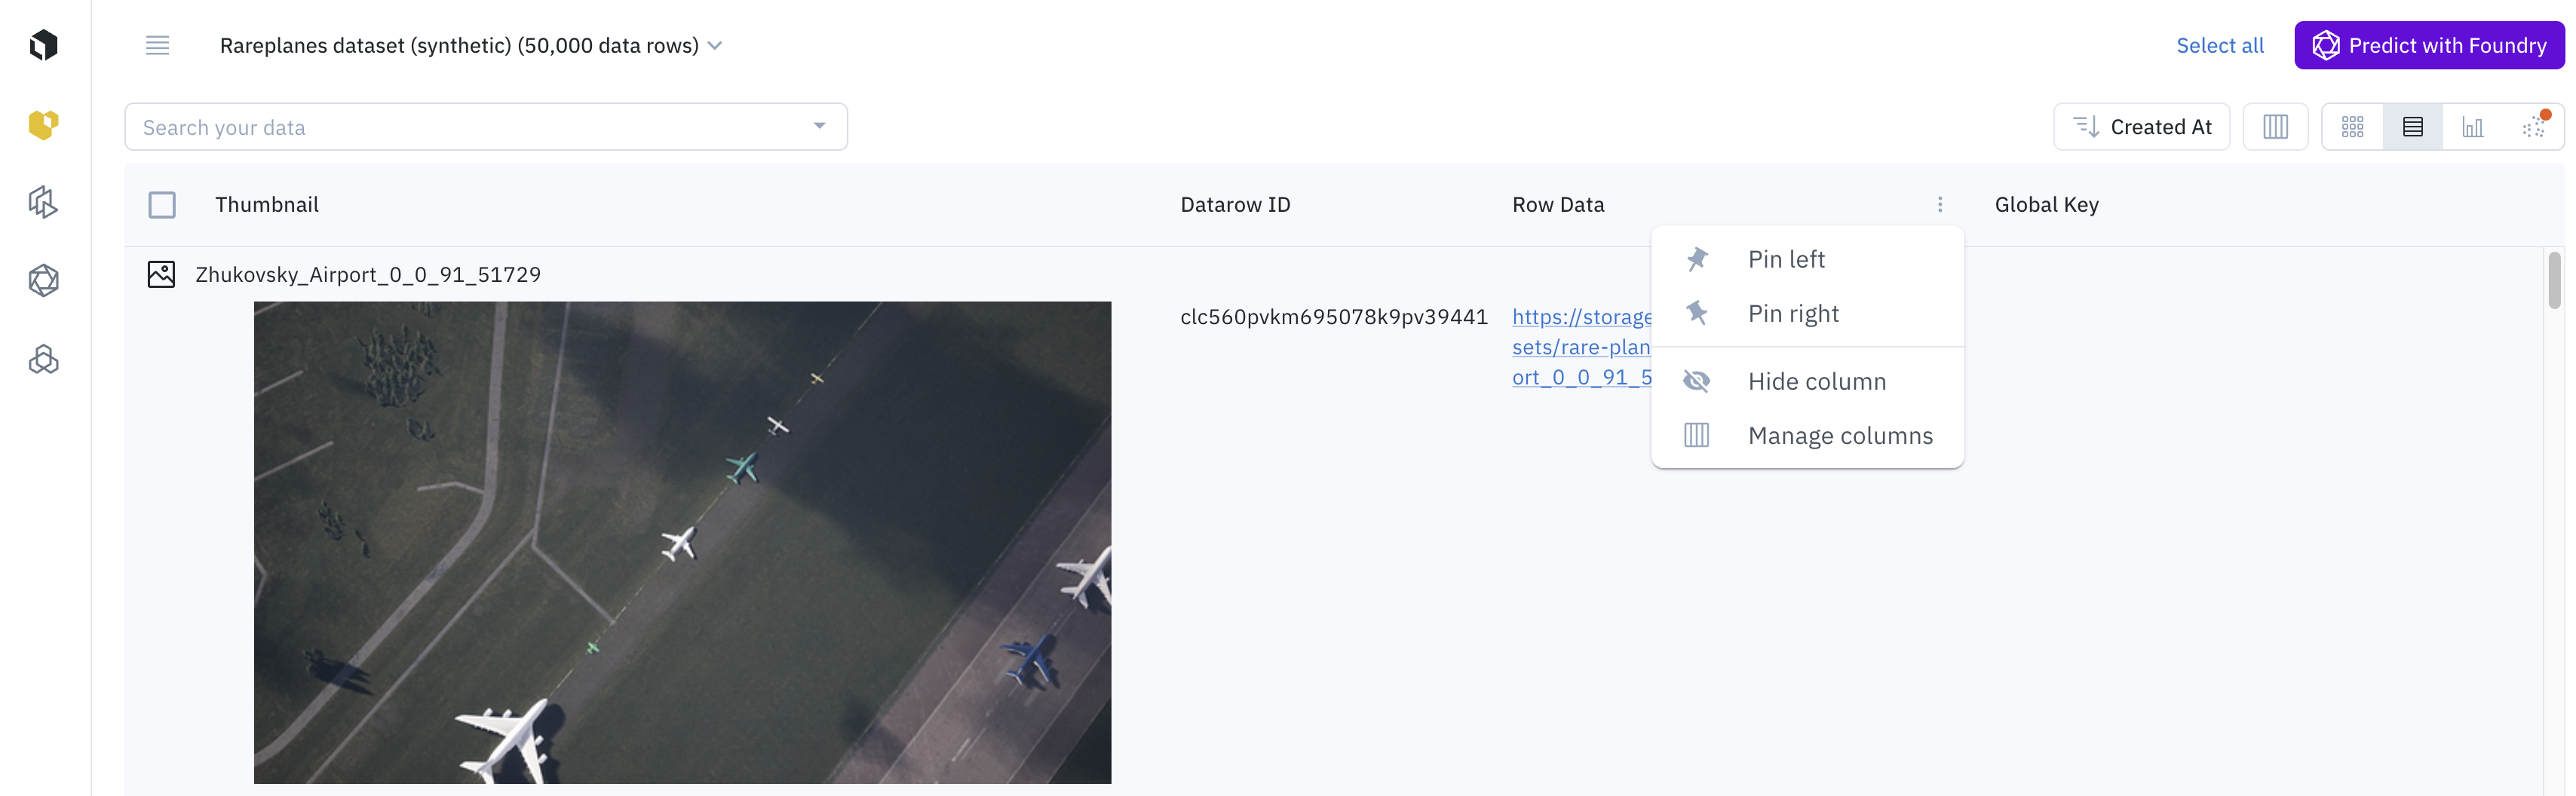
- Use the Manage columns button to customize which metadata fields are displayed in the table, tailoring the view to your specific task.
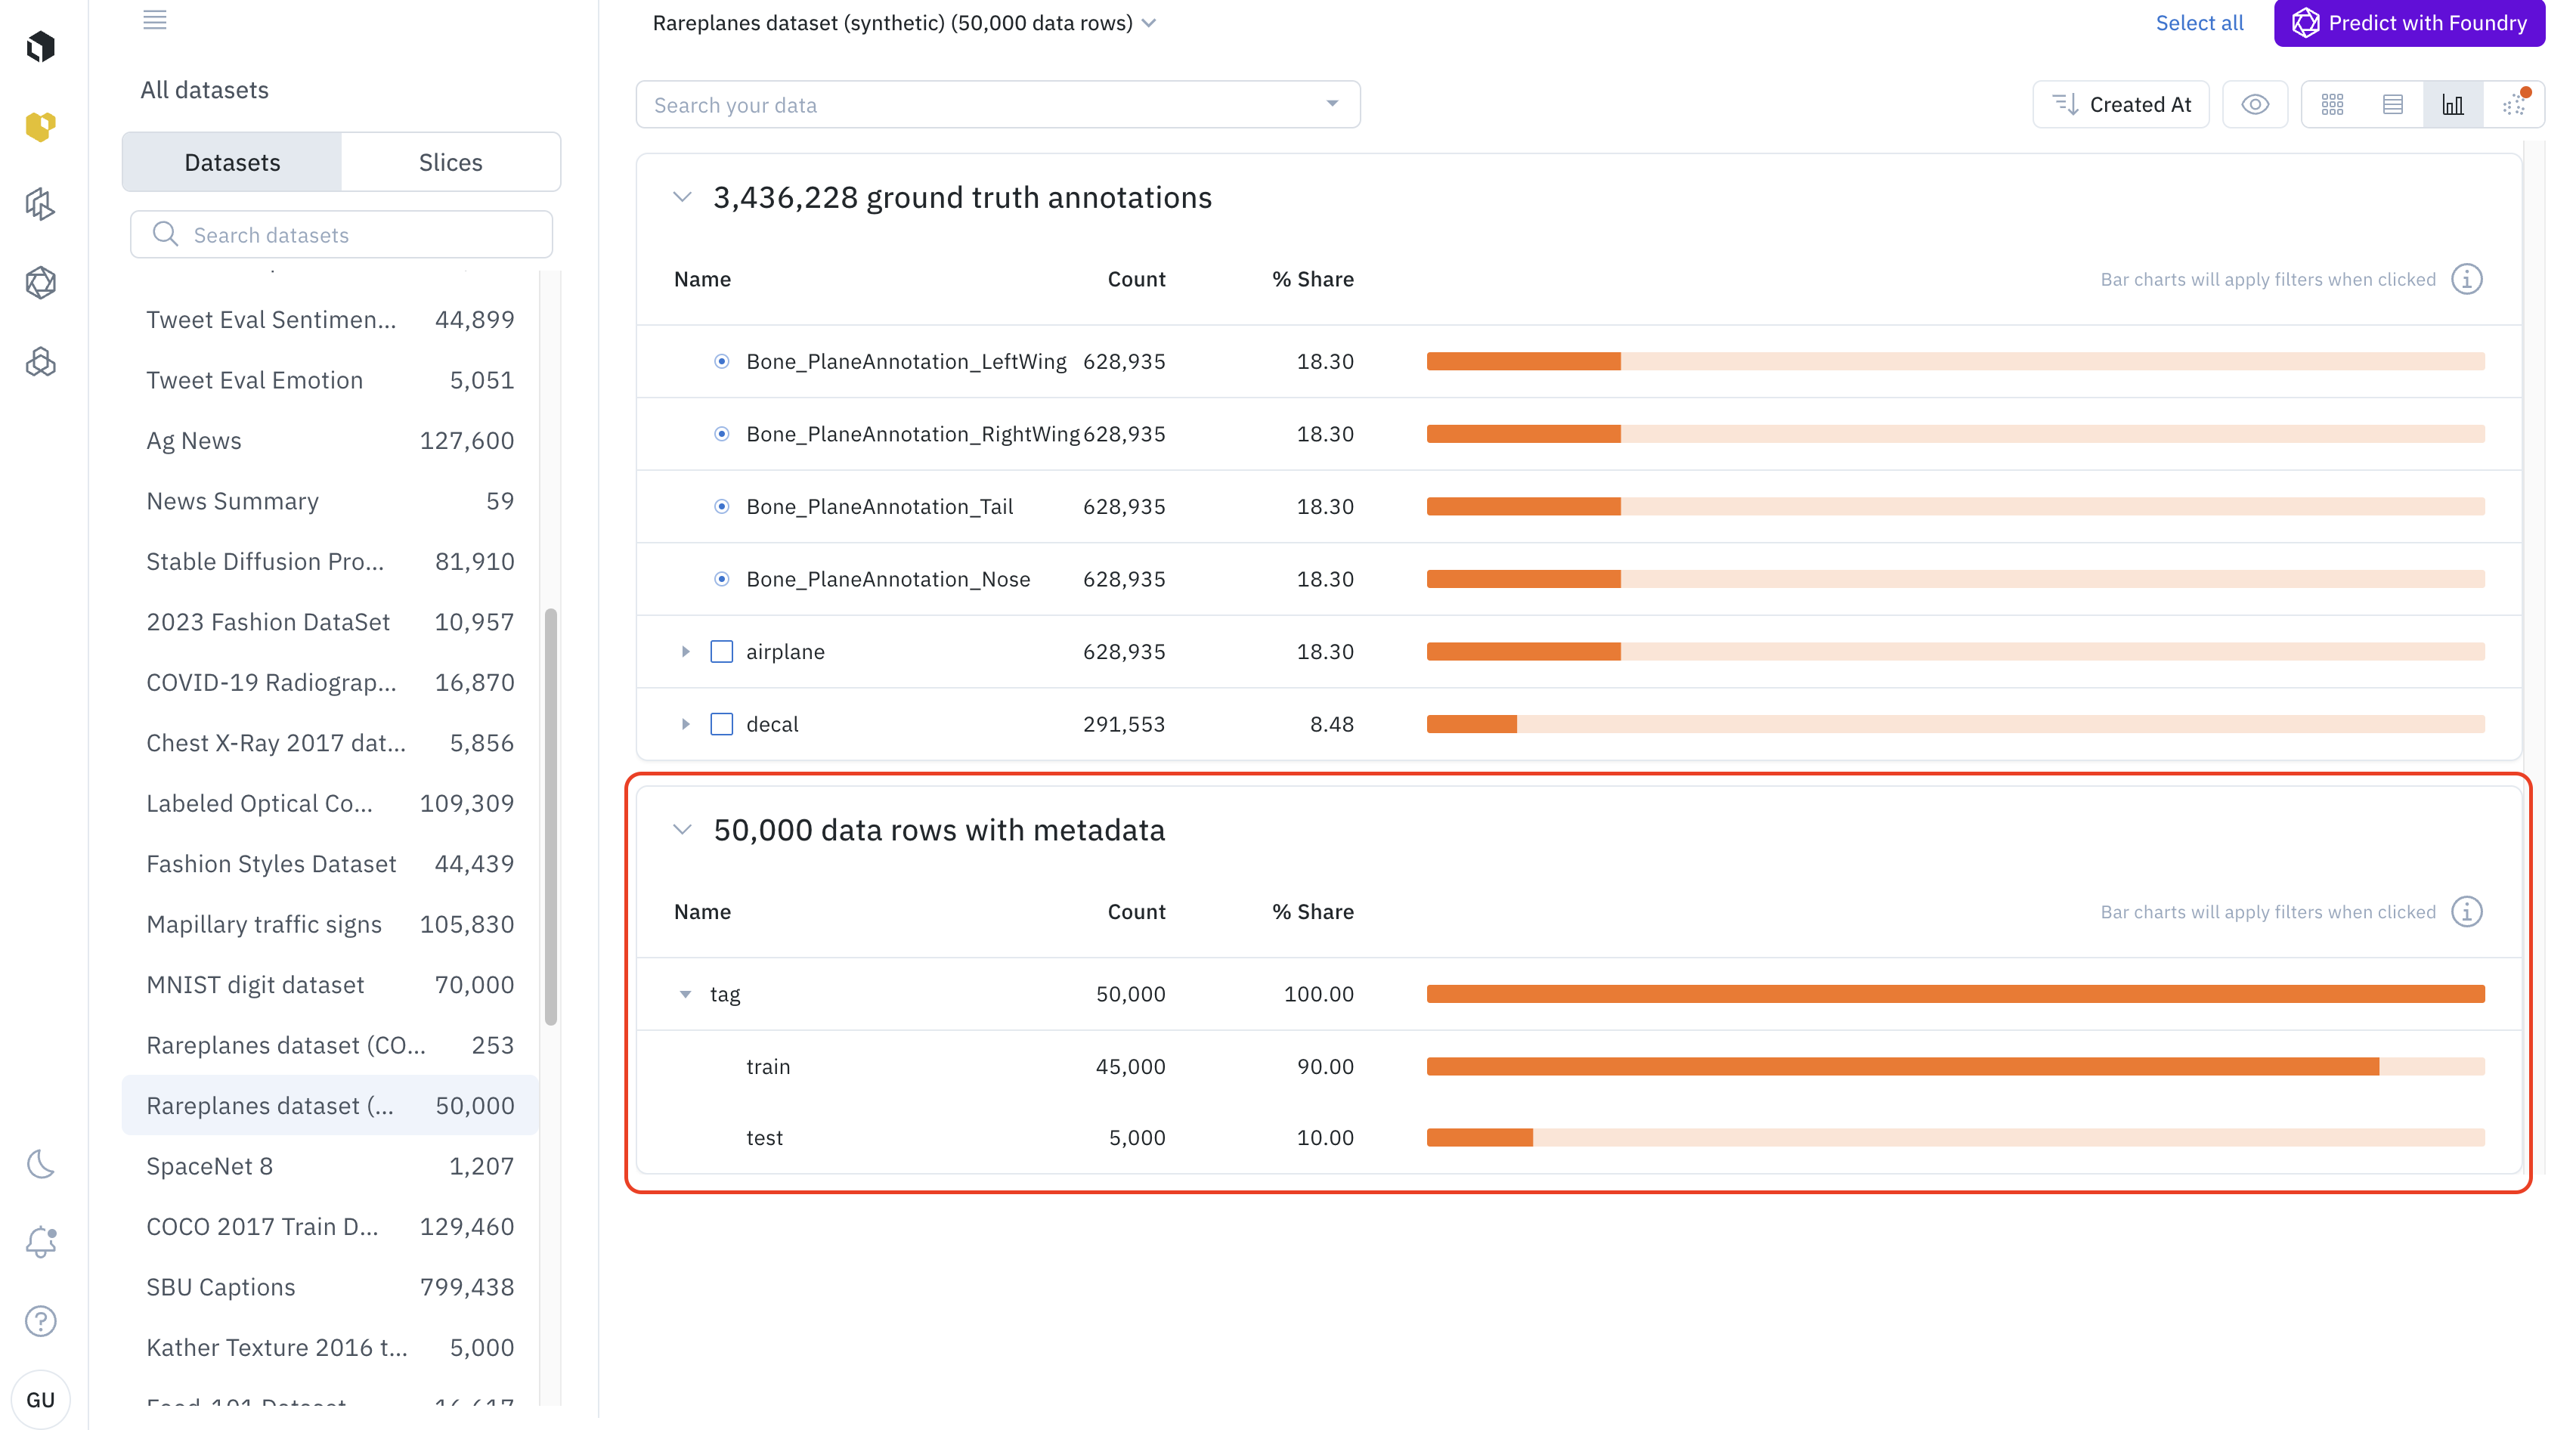
Analytics view
The analytics view provides interactive charts and graphs that summarize the distribution of data in your current selection.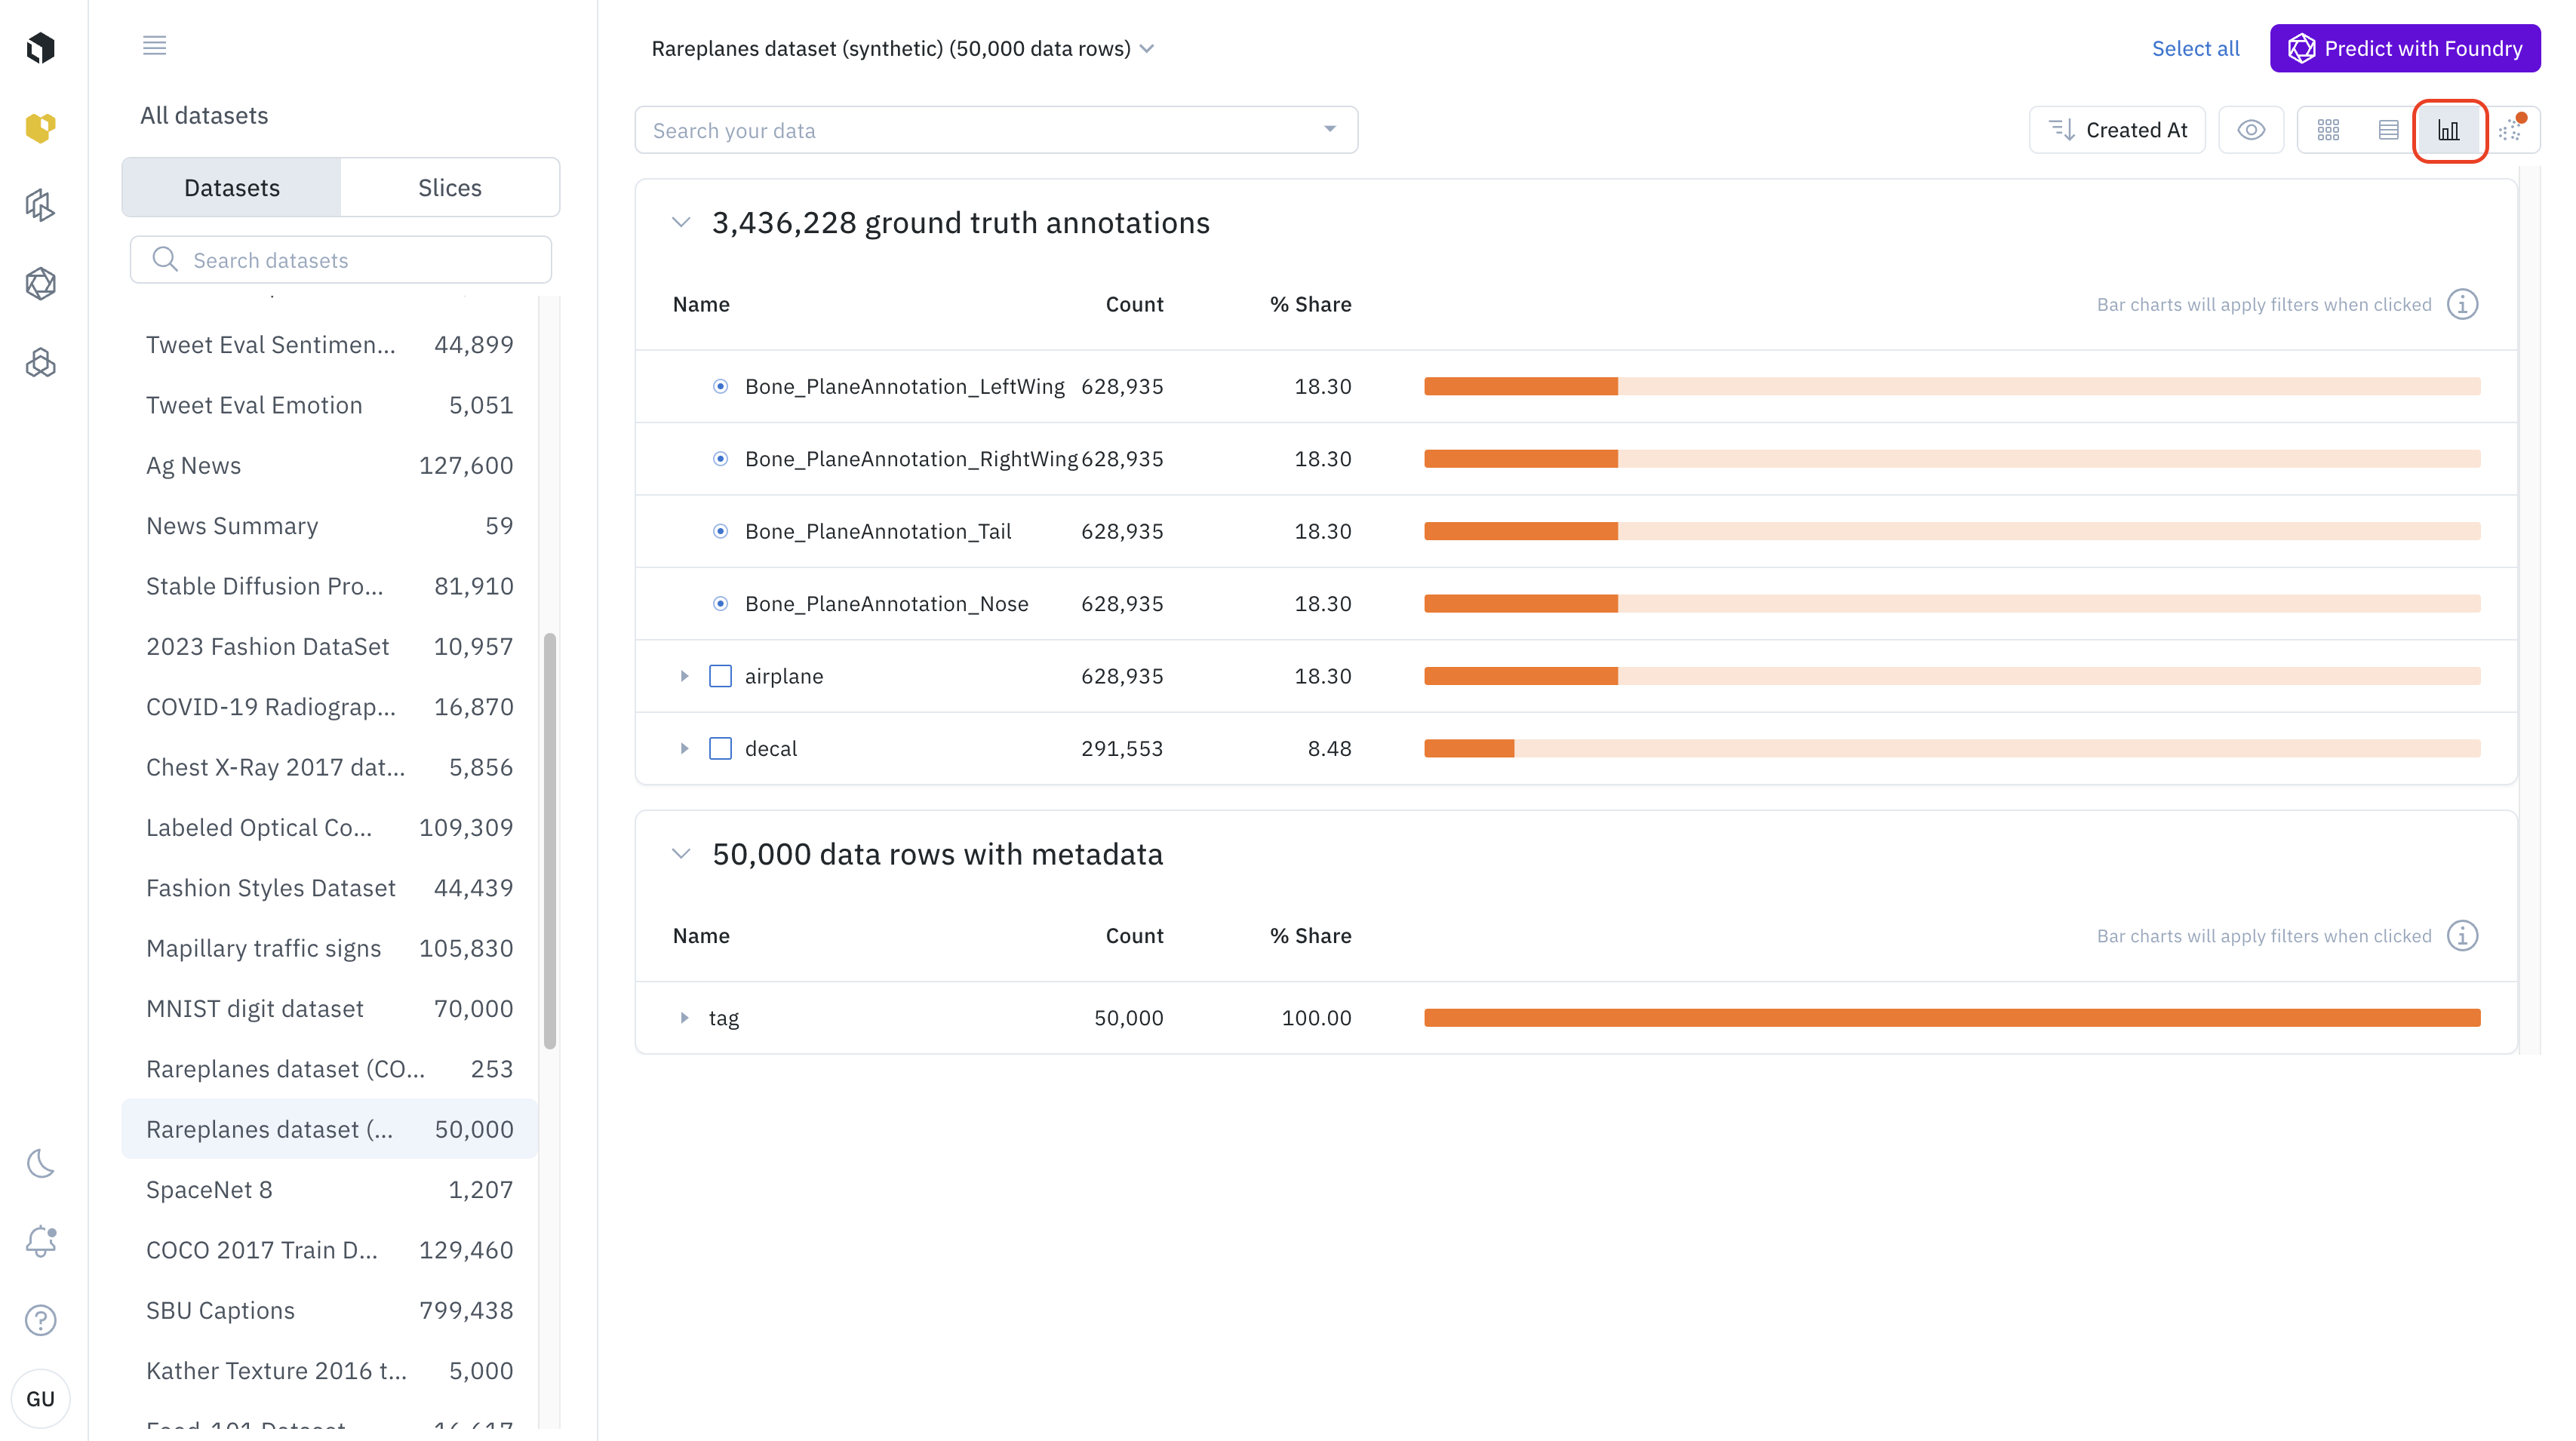
- Best for: Understanding the composition of your dataset, identifying class imbalances, and seeing how your data is distributed across different metadata values.
- How to use it:
- Switch to the analytics view using the view-selector icon.
- The view will display histograms and charts for your data’s attributes.
- You can click on a bar in any chart (e.g., a specific annotation class) to automatically filter your dataset down to only the data rows with that attribute.
Detailed view
The detailed view allows you to perform a deep dive into a single data row.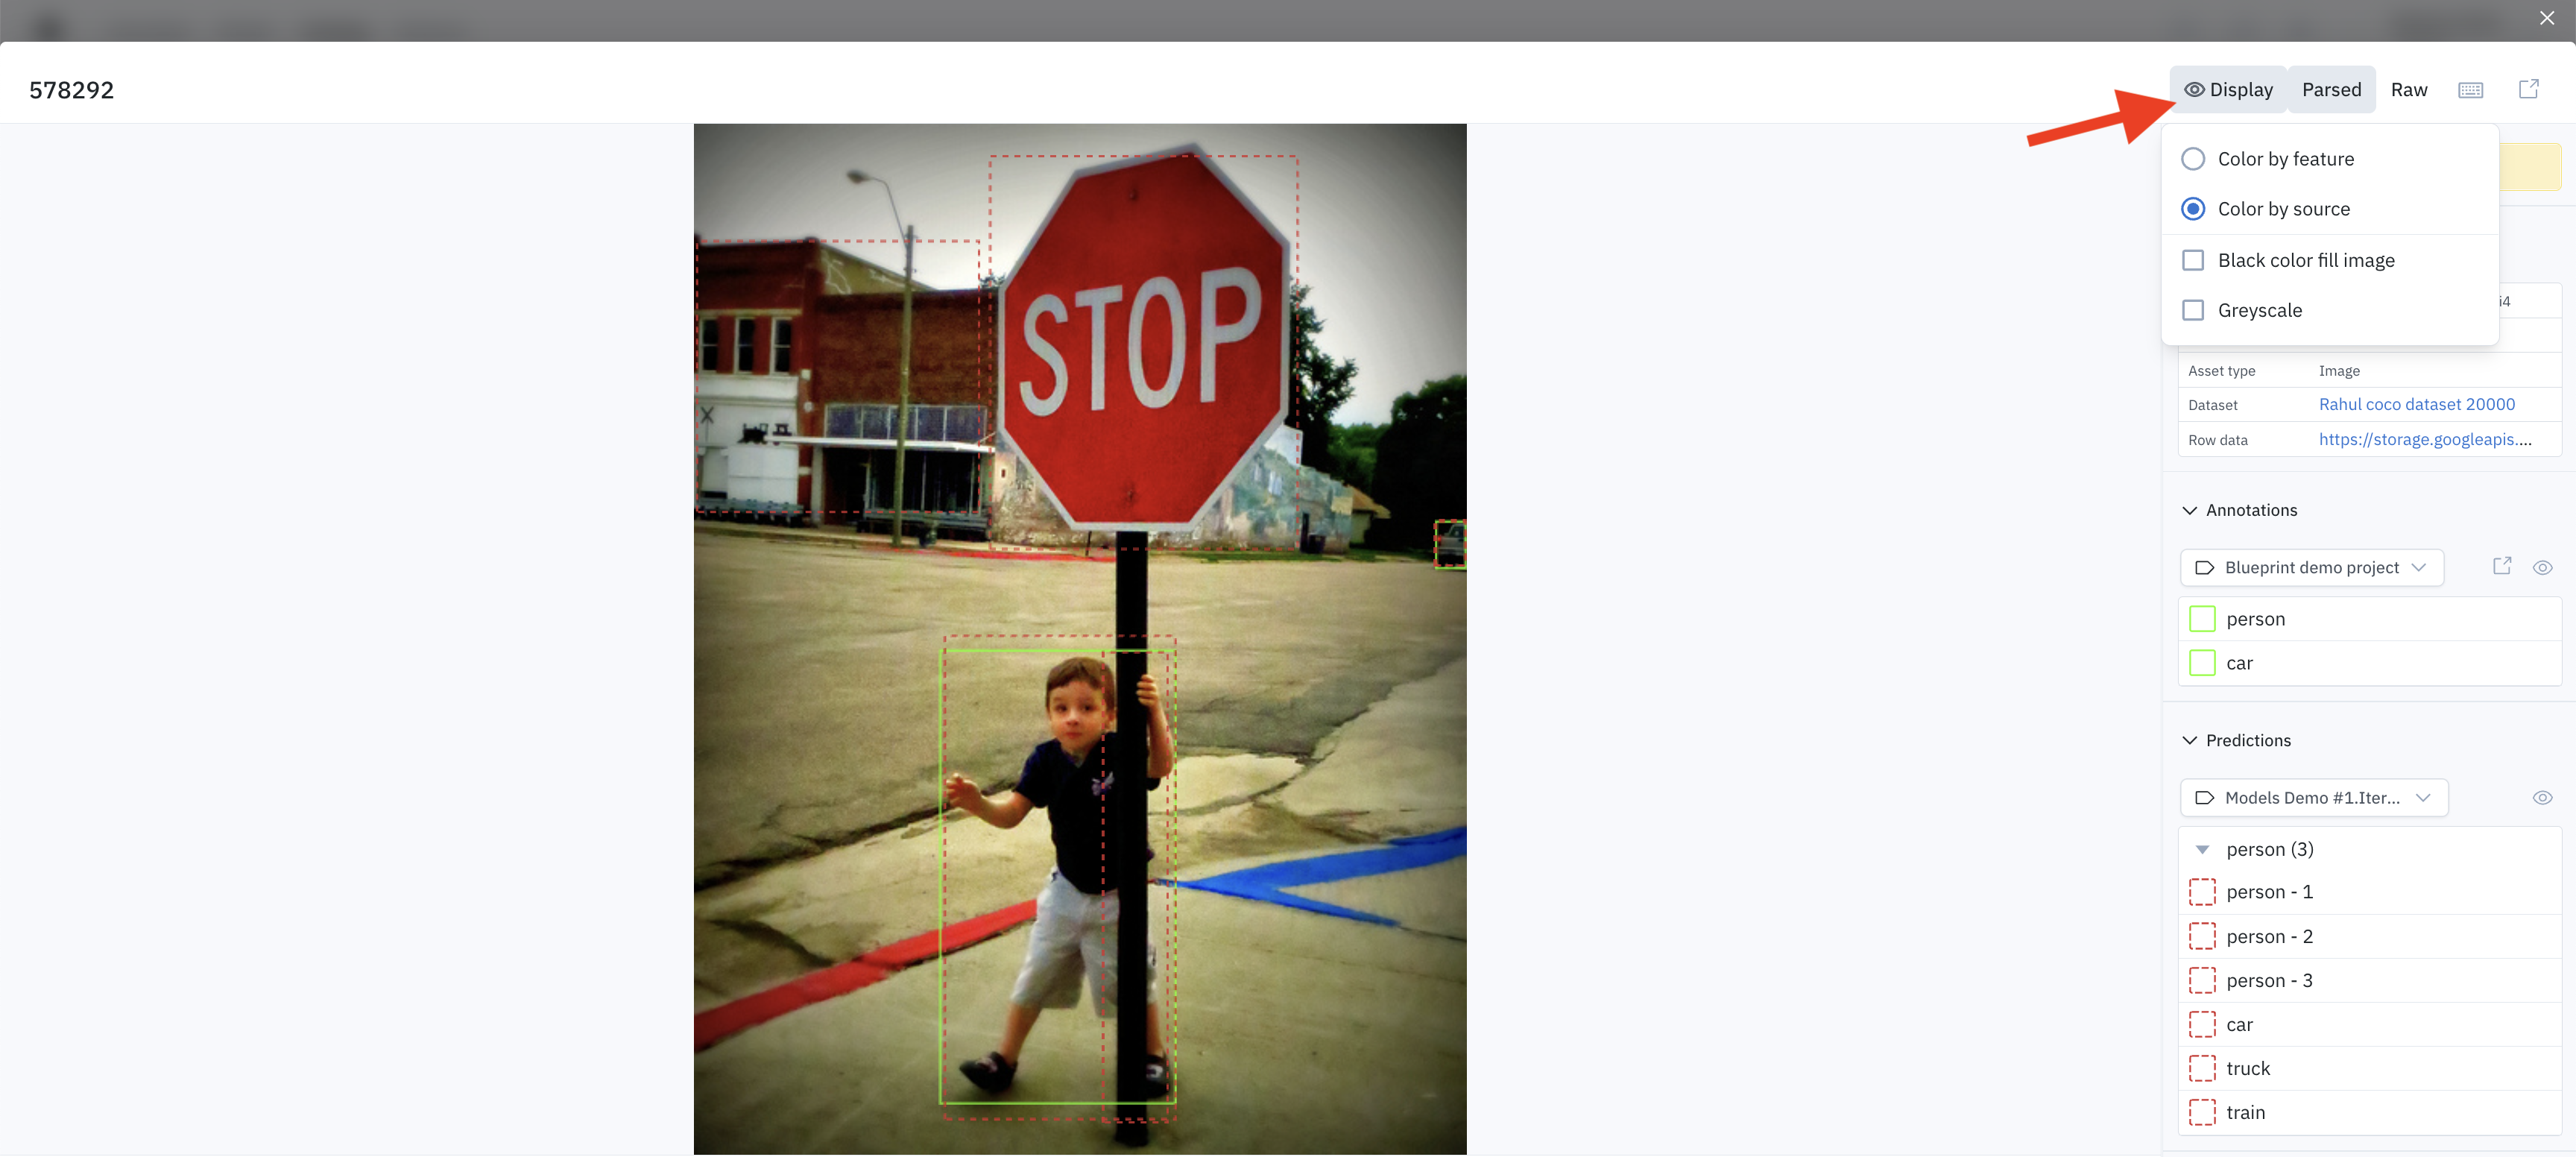
Detailed view display settings
- Best for: Inspecting an individual data asset, viewing all of its associated metadata, examining its annotations, and accessing all related information in one place.
- How to use it: Simply click on any data row from the gallery, list, or cluster view to open the detailed view. Here you can see the asset itself, edit metadata, view annotation history, and more.